Figure 2.
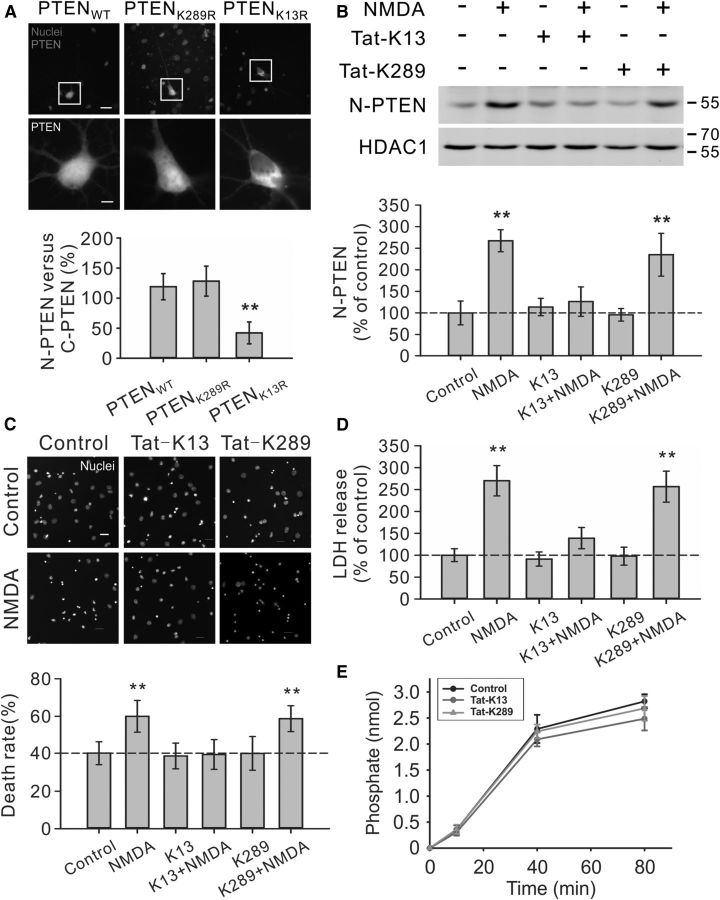
Critical role of PTEN K13 in NMDA-induced PTEN nuclear translocation and neuronal death in cultured neurons. A, K13, but not K289, residue of PTEN is critically important for PTEN nuclear accumulation in neurons. Images (top panels) and nuclear fluorescent intensity qualification (bottom bar graph; n = 33 cells per group, from three independent experiments) demonstrated that the GFP signal of GFP-PTENK13R mutant was predominantly cytoplasmic, being excluded from the nucleus, whereas the GFP signal of either wile type PTEN (GFP-PTENWT) or K289R mutant (GFP-PTENK289R) exhibited a relatively even distribution in both nuclear and cytoplasmic compartments. Scale bar, 20 μm. B, Pretreatment of cultured neurons with interfering peptide Tat-K13 (10 μm), but not Tat-K289 (10 μm), completely blocked the NMDA-stimulated PTEN nuclear translocation as demonstrated by immunoblotting of nuclear fractions (n = 4 culture dishes per group, from four independent experiments). Nuclei fractionation was performed at 6 h after NMDA stimulation (25 μm for 1 h). C, D, Tat-K13 prevents NMDA-induced excitotoxicity. Tat-K13 (10 μm), but not the control peptide Tat-K289 (10 μm), decreased the number of neurons displaying nuclei condensation/fragmentation (C, n = 8 culture wells per group, from three independent experiments, four visual fields were randomly selected from each culture well and averaged; scale bar, 20 μm) and reduced LDH release (D, n = 27 culture wells per group, from three independent experiments). Both assays were performed at 6 h after NMDA stimulation (25 μm for 1 h). E, In vitro PTEN lipid phosphatase activity assays revealed that within the concentration tested (10 μm), neither the interfering peptide Tat-K13 nor the control peptide Tat-K289 had significant effects on the production of free phosphates from the lipid substrate PIP3 by recombinant PTEN (n = 3). Bars represent the group means, and error bars represent SD. Post hoc analysis compares treatment groups with control group after significant one-way ANOVA or Kruskal–Wallis on ranks, and significance is defined as *p < 0.05, **p < 0.01.

