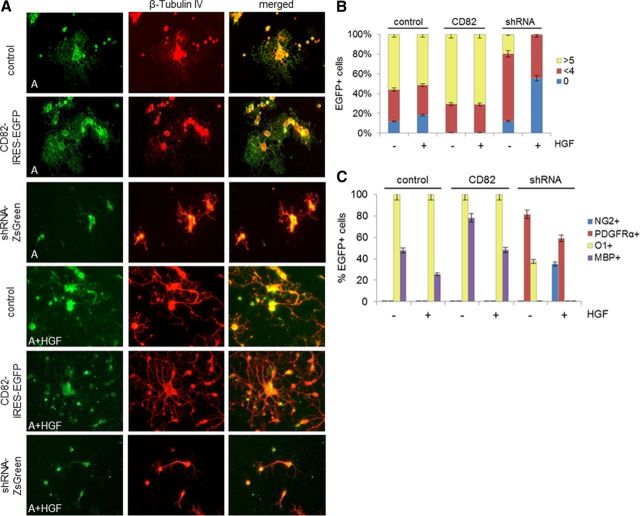
Figure 5.
CD82 and HGF effects on adult O4+ cells in vitro. A, Immunofluorescence for β-tubulin IV on adult O4+ cells infected with CD82–IRES–EGFP, shRNA–ZsGreen, or control–IRES–EGFP retrovirus after 7 d in vitro in the absence or presence of HGF. Representative 40× fields are shown. Final magnification, 250×. B, Diagram of percentages (as presented in Table 1) of GFP+ cells (adult O4+ cells infected with CD82–IRES–EGFP, shRNA–ZsGreen, or control–IRES–EGFP retrovirus) in relation to number of processes: round cells with no processes (0) and cells with less than four (<4) or more than five (>5) processes, after 7 d in culture with (+) or without (−) HGF. C, Diagram of percentages of GFP+ cells (as described in B) in relation to NG2, PDGFRα, O1, and MBP expression after 7 d in culture with (+) or without (−) HGF (A, adult; control, control–IRES–EGFP; CD82, CD82–IRES–EGFP; shRNA, shRNA–ZsGreen).

