Figure 2.
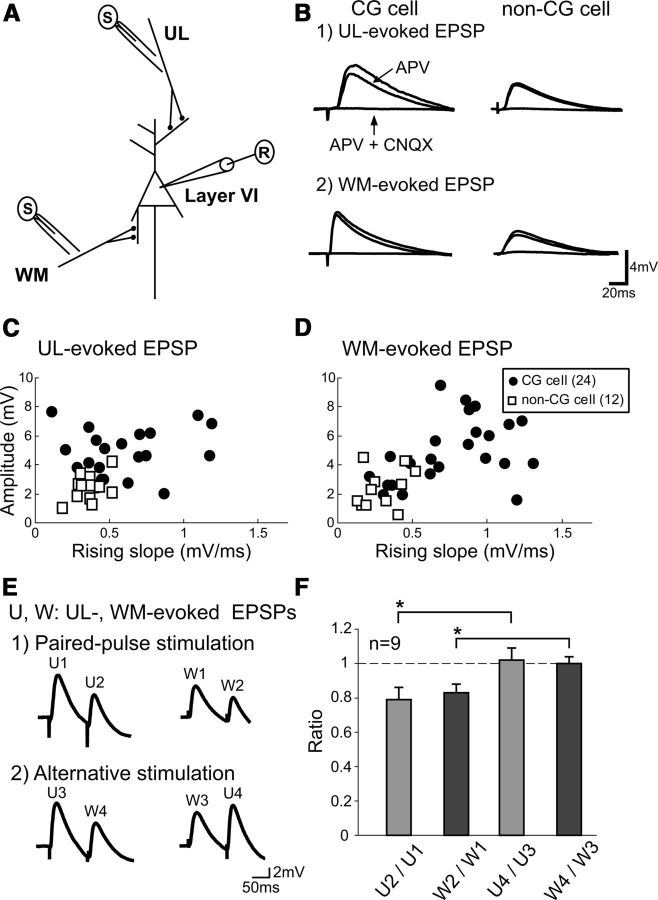
EPSPs recorded from CG and non-CG cells in cortical layer VI in response to stimulation of the UL and WM sites. A, Arrangement of stimulating and recording electrodes in visual cortical slices. B, Examples of EPSPs of a layer VI CG cell (left column) and a non-CG cell (right column) evoked by test stimulation of the UL (1) and WM (2) sites without any drug (top traces), with APV (middle traces) and APV plus CNQX (bottom traces). Scales at bottom right apply to all records. C, The peak amplitude of UL-evoked EPSPs is plotted against their rising slope for 24 CG cells (filled circles) and 12 non-CG cells (open squares) in cortical layer VI. D, The peak amplitude of WM-evoked EPSPs is plotted against their rising slope for the CG cells and non-CG cells in layer VI. The other conventions are the same as in C. E, EPSPs evoked by paired pulses applied to the same site at an interval of 100 ms (1). EPSPs evoked by stimulation given to the two different sites alternately at an interval of 100 ms (2). U1 to U4 indicate EPSPs evoked by test stimulation of the upper layer site. Also W1 to W4 indicate EPSPs evoked by test stimulation of the WM site. Scales at bottom right apply to all of the records. F, Mean ratios of the amplitudes of the second EPSPs to the first ones evoked by two successive stimulations, as indicated at the abscissa. The vertical bars indicate SEM.

