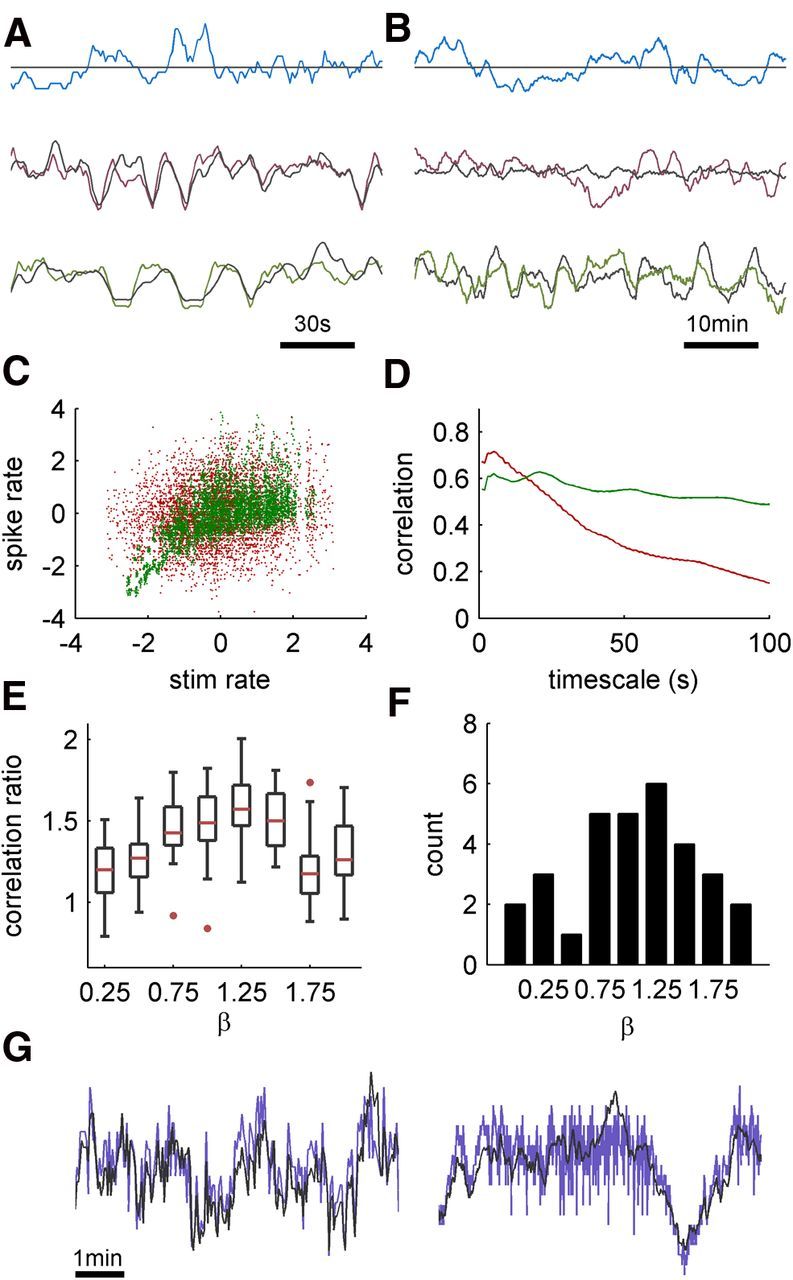
Figure 3.

Input and output correlations under the three stimulation regimes. A, Extracts from the response rates of a neuron to long stimulation (1 h) under the three regimes. Responses and stimulation are binned with a 5 s bin size; 30 bins are shown. Mean is subtracted to have the input and output aligned. The responses under white noise and scale-free regimes follow the stimulation closely (black line), while for constant interval the variability is freely running. B, Extracts from the same experiment, using a 100 s bin size; 30 bins are shown. The response in the scale-free regime is still locked to stimulus fluctuations, while input fluctuations in the white noise regime are substantially diminished, therefore unable to lock response variability. C, A scatter plot of the stimulation rate against response rates, calculated with a 5 s bin size. White noise input in red, scale-free input in green. Mean is removed for visual clarity, and both axes are in standardized units. While the marginal distributions for both inputs are similar, the correlation in the scale-free case is significantly higher. D, Scaled correlation analysis. The correlation between input and output rates are calculated in different timescales for white noise and scale-free regimes. The correlation in a given timescale T is calculated by smoothing the series with a rectangular window of width T, and subtracting a version of the series smoothed with a window of size 25T, effectively bandpassing the time series. E, Dependence of the input–output correlation on the exponent β of the input. Neurons (n = 31) were stimulated with blocks of 70 min duration with exponent ranging from 0 to 2. The input–output correlation (cβ) was calculated from the responses of each block, using a 1 s time bin. The graph shows the population statistics of the ratio cβ/c0 for each β, using box-and-whisker plot. The red horizontal line marks the median, the box marks the lower and upper quartiles and the whiskers the range of data values. Outliers (values outside the range of 3 SD units from the average value) are marked with red points. F, Distribution of preferred exponent values (the exponents, which result in the strongest correlation for each neuron). G, Extracts comparing the entrainment for β = 1 (left) and β = 2 (right), from a single neuron, demonstrating lack of entrainment for the fast fluctuations for the latter case. Traces are smoothed with a 2 s rectangular window, timescale is identical for the two extracts.
