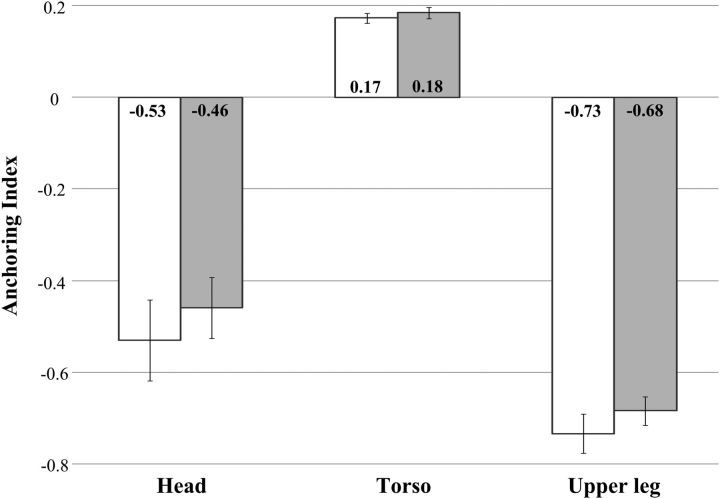
Figure 4.
Average AP anchoring index for body segments (head, torso, and upper leg) across all participants as a function of the covibration location during normal stance. White and gray bars correspond to the B IO and B ES covibration conditions, respectively. Error bars indicate SE, and the numbers inside the bars indicate the corresponding average values.

