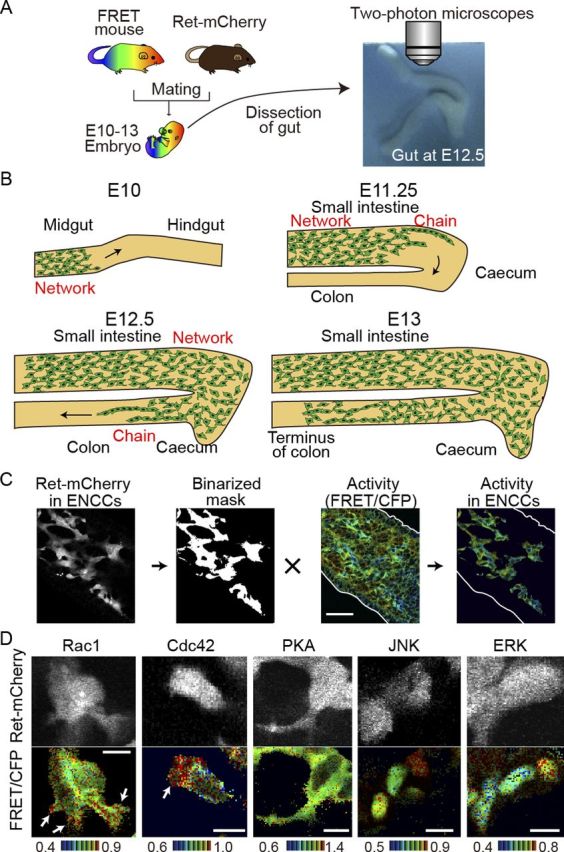
Figure 1.

Activities of signaling molecules in ENCCs by means of ex vivo imaging of transgenic mice expressing FRET biosensors. A, A FRET mouse was crossed with a Ret-mCherry mouse. The gut was dissected from an embryo and cultured on a piece of sterile paper. B, A schematic illustration showing the migration of ENCCs in the developing gut at E10–E13. C, Image processing for the preparation of activity maps of signaling molecules in ENCCs. ENCCs are identified by the Ret-driven expression of mCherry. The mCherry images are binarized to generate masks, which are used to crop ENCCs from the FRET/CFP ratio image. The FRET/CFP ratio images are presented in the intensity-modulated display (IMD) mode. In the IMD mode, eight colors from red to blue are used to represent the FRET/CFP ratio, with the light intensity of each color indicating the mean intensity of FRET and CFP. D, Activities of signaling molecules in single ENCCs. The FRET/CFP ratio images and Ret-mCherry images are shown. The ratio ranges are shown at the bottom of the panel. The FRET biosensors of Rac1 and Cdc42 are localized at the plasma membrane, that of PKA is localized in the cytoplasm, and those of JNK and ERK are localized in the nucleus. Scale bars, 10 μm.
