
Figure 3.
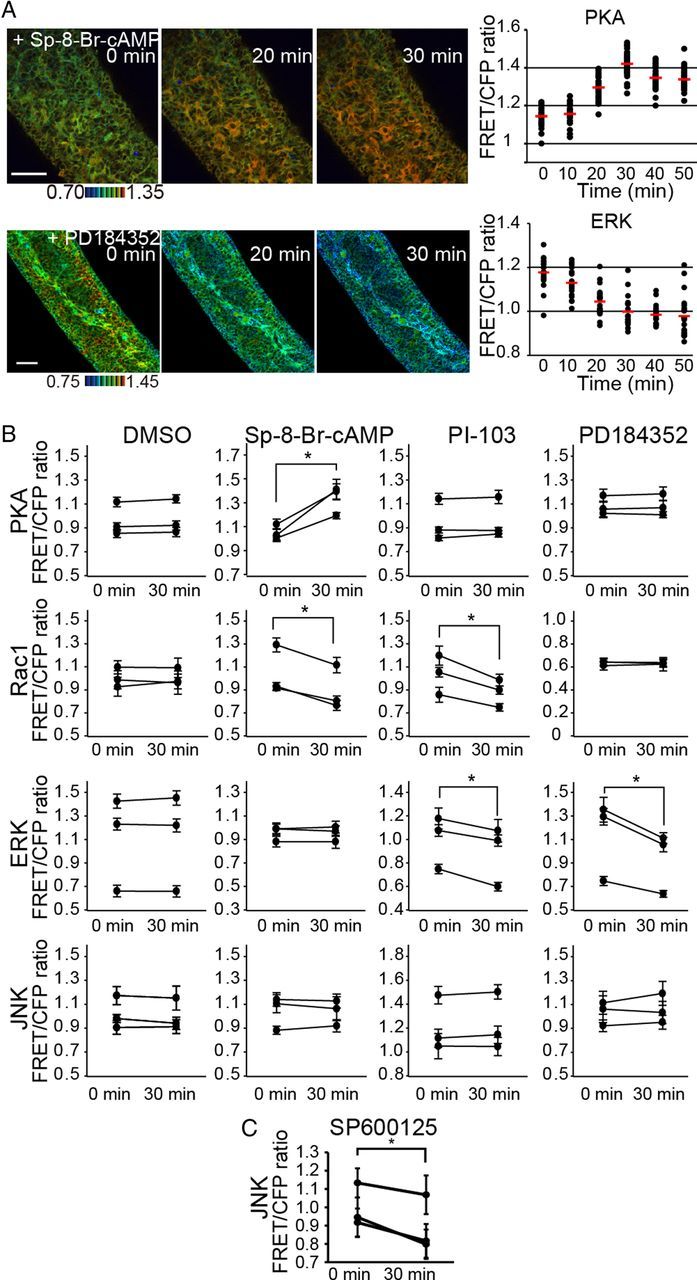
Regulation of Rac1 activity by PKA and PI3K, but not by ERK, in ENCCs. A, Embryonic gut organ cultures prepared from transgenic mice expressing a biosensor for PKA and ERK were time-lapse imaged and examined for the effect of 120 μm SP-8-Br-cAMP and 10 μm PD184352, respectively. Shown here are representative FRET/CFP ratio images in IMD mode and of FRET/CFP at the indicated time points after drug treatment. Scale bars, 50 μm. Data points represent the FRET/CFP ratio of each ENCC at the indicated time points. The mean FRET/CFP ratio at each time point is represented by a red line. B, ENCCs in organ culture were treated with DMSO, 120 μm SP-8-Br-cAMP, 30 μm PI-103 and 10 μm PD184352 for 30 min. The FRET/CFP ratios of >20 cells were measured for each organ culture before and after drug treatment. Data obtained from three independent organ cultures are shown. The asterisks indicate statistical significance by the paired t test analysis (p < 0.05). Error bars show the SD. C, ENCCs in organ culture were treated with 30 μm SP600125 for 30 min. The FRET/CFP ratios of >20 cells were measured for each organ culture before and after drug treatment. Data obtained from three independent organ cultures are shown. The asterisks indicate statistical significance by the paired t test analysis (p < 0.05). Error bars show the SD.