
Figure 4.
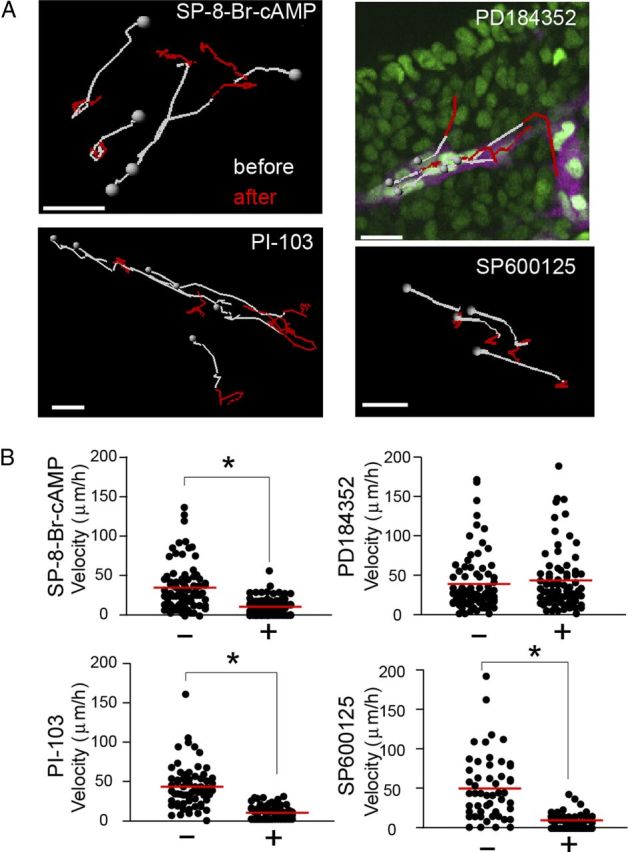
Regulation of ENCC motility by PKA, PI3K, and JNK, but not by ERK. A, Transgenic mice expressing JNKAR1EV-NLS and Ret-mCherry were used for the tracking of ENCCs, because the nuclear localization of the biosensor allowed automatic tracking by the software. During time-lapse imaging, the following reagents were added (in μm): 120 SP-8-Br-cAMP, 30 PI-103, 10 PD184352, and 30 SP600125. The nuclei of ENCCs were tracked for 30 min before drug treatment (white) and for 30 min after drug treatment (red). Gray spheres represent the start position of the trajectories. Scale bars, 20 μm. B, Migration velocities before and 30 min after the drug treatment. Data points represent individual cells compiled from three independent experiments. The red lines represent mean migration velocities of ENCCs. The asterisks indicate the results of t test analysis; *p < 0.05.