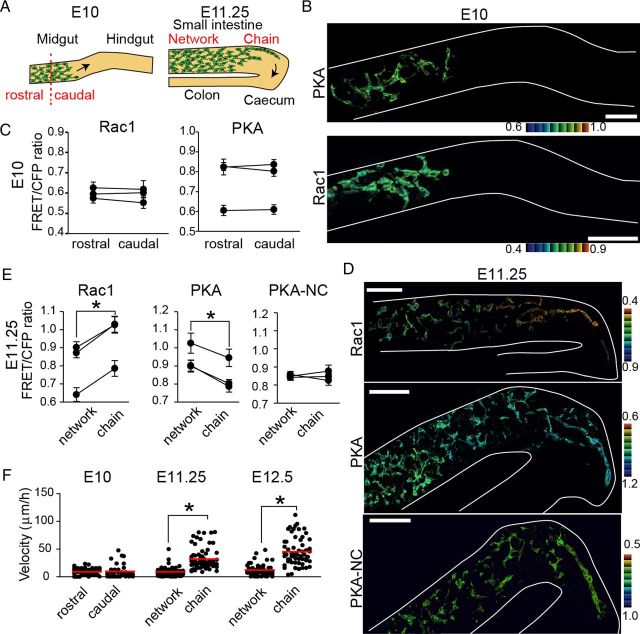
Figure 5.
Migration velocity positively correlated with Rac1 activity and negatively correlated with PKA activity in the early stages of ENCCs. A, A schematic illustration of migrating ENCCs at E10 and E11.25. B, Representative FRET images of ENCCs expressing the FRET biosensors for PKA and Rac1 at E10. Scale bars, 50 μm. C, Mean FRET/CFP ratios of ENCCs in the rostral or caudal region at E10. FRET/CFP ratios of >15 cells were averaged for each organ culture and the results of three independent experiments are shown. Error bars show the SD. D, Representative FRET images of ENCCs at E11.25. Scale bars, 50 μm. E, Mean FRET/CFP ratios of ENCCs migrating as chains or forming a network at E11.25. FRET/CFP ratios of >20 cells were averaged for each organ culture and the results of three independent experiments are shown. The asterisks indicate statistical significance by paired t test analysis (p < 0.05). Error bars indicate SEM. F, Migration velocity of ENCCs expressing the biosensor for PKA at E10, E11.25, and E12.5. Data points represent individual cells compiled from three independent experiments. The red line represents the mean migration velocities of ENCCs. The asterisks indicate statistical significance by t test analysis (p < 0.05).

