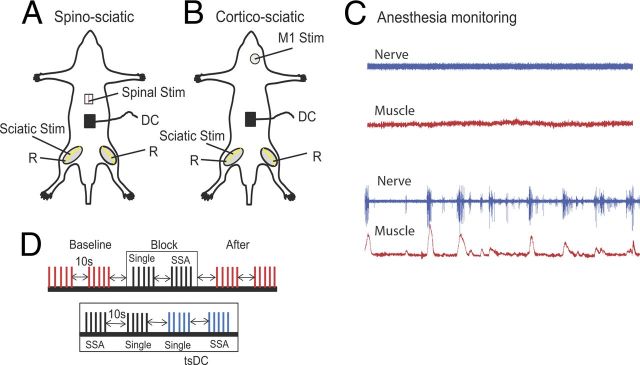
Figure 1.
Schematic diagram of the acute experimental setup illustrating two stimulation arrangements. A, SSA stimulation setup, in which spinal cord level L1 was stimulated at the dorsal column (bipolar needle electrode). B, CSA stimulation setup, in which the M1 area of the crural muscles was stimulated. In both arrangements, the sciatic nerve was stimulated on one side, usually the left. Evoked potentials were recorded from both sciatic nerves (R, recording). DC was applied over the lumbar spine. C, Level of anesthesia was monitored by observing the spontaneous activity of nerve (blue) and muscle (red). The top shows the desired level at which all recording and stimulation is performed; the bottom shows a level when anesthesia was starting to wear off. D, Schematic illustration showing part of the ISI stimulation protocol. The protocol consisted of baseline (trains of 5 shocks at 0.5 Hz, repeated every 10 s), a block of SSA-only (train of 5 single shocks at 0.5 Hz, 10 s break, train of 5 SSA at 0.5 Hz), and posttest stimulation identical to baseline. Bottom shows a block of SSA + tsDC, which consisted of a train of five single shocks with no tsDC, a train of five single shocks during tsDC, SSA with no tsDC, and SSA during tsDC. This paradigm was repeated to test all ISIs and to test CSA.

