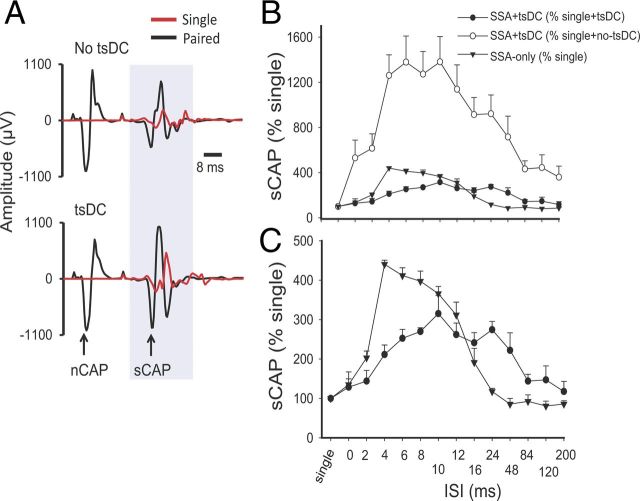
Figure 4.
Spinal excitability enhancement by SSA stimulation or SSA + tsDC. A, Top shows examples of sCAP and nCAP. The red trace is an sCAP evoked by single pulse, and the black trace shows two responses, the first in response to nCAP and the second in response to spinal stimulation. No tsDC was applied during this recording. Bottom shows examples of sCAP and nCAP during tsDC (−0.8 mA). Spinal stimulus intensity was the same during single, paired, no-tsDC, and tsDC conditions, and nerve stimulus intensity was the same during no-tsDC and tsDC conditions. B, Summary plot showing percentage change in sCAP during SSA and SSA + tsDC. sCAP evoked during SSA protocol were expressed as percentage of baseline sCAP evoked by single-pulse stimulation. sCAP evoked during SSA + tsDC were expressed both as a percentage of single-pulse during no-tsDC and as a percentage of single-pulse during tsDC. C, The data for SSA + tsDC and SSA-only from B are shown to clearly illustrate the difference between the two groups.

