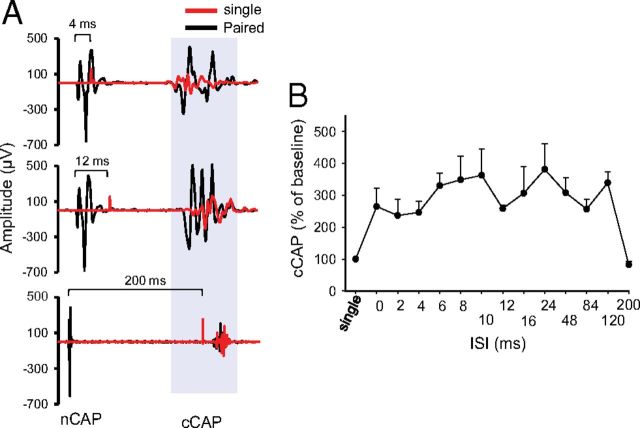
Figure 7.
CSA stimulation enhanced contralateral cortical output. A, Sample traces of cCAP. Top shows single-pulse-induced cCAP (red) overlapped over CSA-induced trace (black) at 4 ms ISI. In all CSA traces, the first potential is the nCAP and the second is cCAP. The middle trace shows an overlay of single-pulse-induced cCAP (red) and 12 ms ISI CSA trace (black). The bottom shows overlay of single-pulse-induced cCAP (red) and 200 ms interstimulus CSA trace (black). B, Summary plot showing an increase in cCAP during various ISIs expressed as percentage of single-pulse-induced cCAP.

