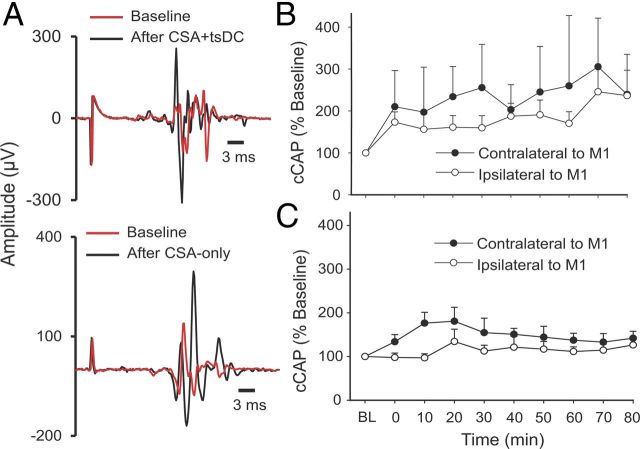
Figure 9.
Long-term enhancement of cCAP. The CSA protocol to induce persistent changes was 90 pulses at 1 Hz and 12 ms ISI, applied with and without tsDC. A, Examples of cCAP. Top shows contralateral cCAP traces recorded at baseline (red) and after CSA + tsDC stimulation (black). Note that pretest and posttest stimuli have identical parameters. Bottom shows contralateral traces of cCAP recorded at baseline (red) and after CSA-only (black). B, Summary plot showing long-term contralateral and ipsilateral changes after the CSA + tsDC stimulation. C, Summary plot showing contralateral and ipsilateral changes after CSA-only. Data are expressed as percentage of baseline (BL).

