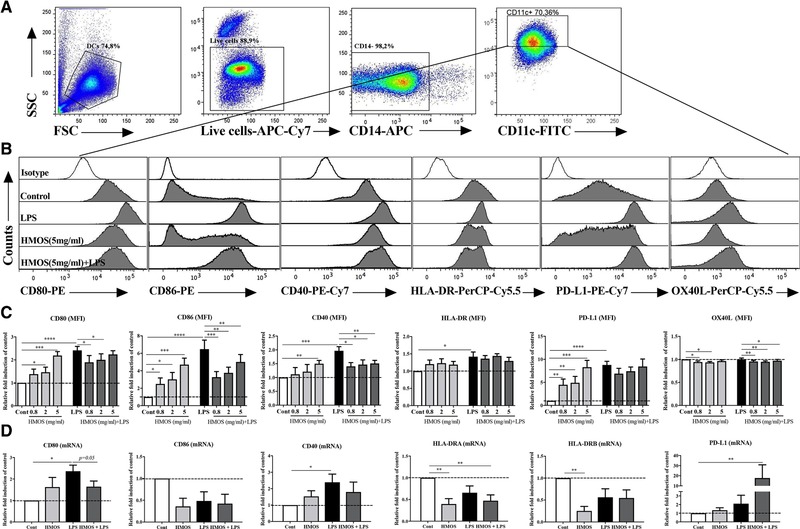
Figure 1.

Effects of HMOS on the maturation status of human moDCs in the absence or presence of LPS. (A) Gating strategy of CD14‐APC negative DCs. (B) Representative histograms and (C) (Median Fluorescence Intensity (MFI)) of co‐stimulatory molecules CD80‐PE, CD86‐PE, CD40‐PE‐Cy7, and HLA‐DR‐PerCP‐Cy5.5, and inhibitory molecules PD‐L1‐PE‐Cy7 and OX40L‐PerCP‐Cy5.5. expression of DCs treated by medium, LPS, HMOS (0.8, 2, 5 mg/mL), and HMOS+LPS. Open histograms represent isotype mAb staining. The y‐axis of the column bar graphs shows the relative expression of surface markers obtained by setting medium control as 1‐fold within one experiment for each donor. (D) mRNA levels of co‐stimulatory molecules CD80, CD86, CD40, and HLA‐DRA, HLA‐DRB, and inhibitory molecule PD‐L1 expression of DCs treated by medium, LPS, HMOS (5mg/ml), and HMOS+LPS. The y‐axis of the column bar graphs shows the relative mRNA expression obtained by setting medium control as 1‐fold within one experiment for each donor. Immature DCs were generated from human PBMC‐derived monocytes, on day 6 immature DCs were stimulated with either medium (control), or HMOS (0.8, 2, 5 mg/mL) in the presence or absence of 100 ng/mL LPS. DCs were collected at 24 h for flow cytometry analysis or at 16 h for mRNA levels by qPCR analysis. Results are presented as mean ± SEM (7‐9 independent experiments (1‐2 donors/experiment) for flow cytometry analysis, and 2 independent experiments (2‐3 donors/experiment) for QPCR analysis). *p < 0.05, **p < 0.01, ***p < 0.001, ****p < 0.001, paired Student's t‐test.
