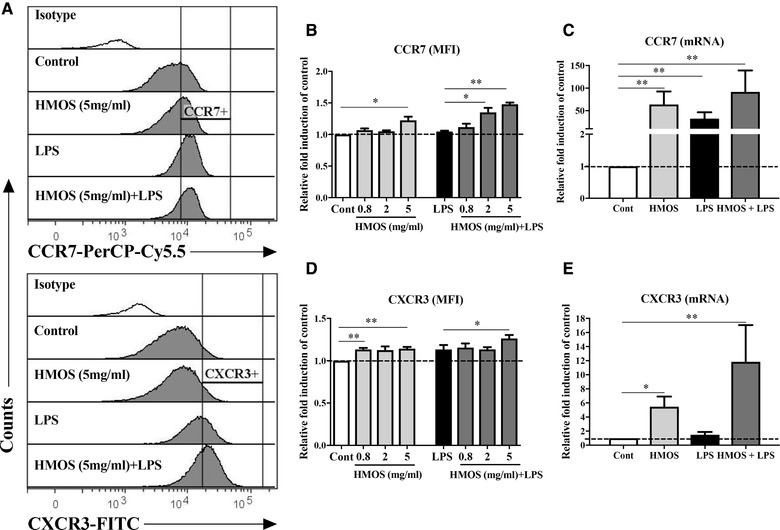
Figure 3.

Effects of HMOS on the migratory marker's expression of human moDCs in the absence or presence of LPS. (A) Representative histograms of CCR7‐PerCP‐Cy5.5 and CXCR3‐FITC expression on the DCs treated by medium, LPS, HMOS (5 mg/ml), and HMOS (5 mg/ml) + LPS. Open histograms represent isotype mAb staining. MFI of (B) CCR7 and (D) CXCR3 expression on human DCs. mRNA expression of (C) CCR7 and (E) CXCR3 on human DCs. iDCs were generated and treated as described in the figure legend 1, after 24 h, DCs were analyzed by flow cytometry and qPCR for the expression of the migration markers CCR7 and CXCR3 at protein and mRNA levels, respectively. Results are presented as mean ± SEM (3 independent experiments (1–2 donors/experiment)). *p < 0.05, **p < 0.01, paired Student's t‐test.
