
Figure 5.
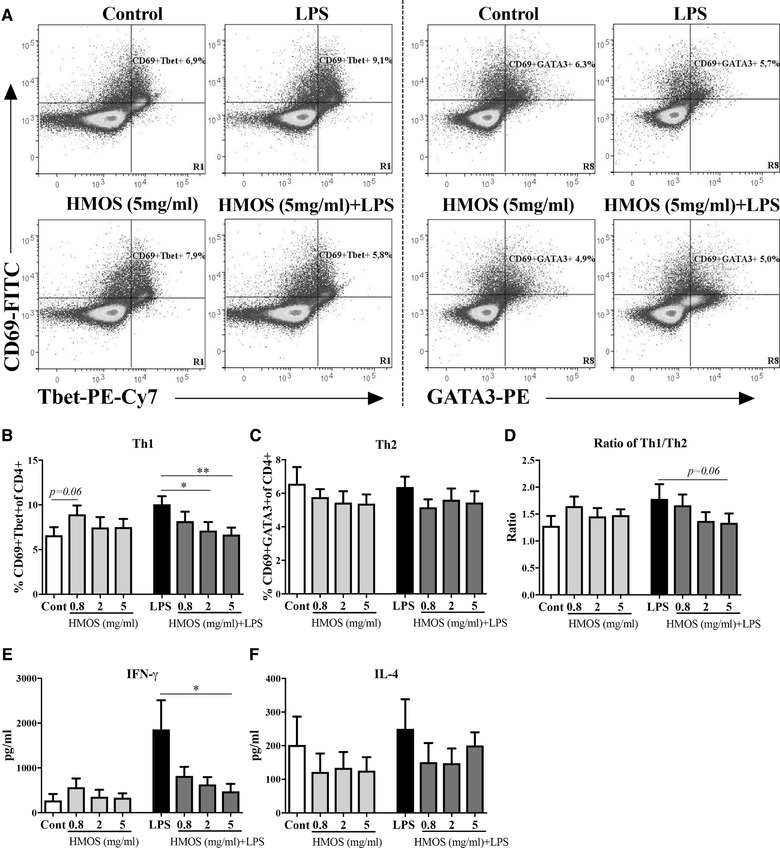
Effects of HMOS‐conditioned human moDCs on the prime of Th1 and Th2 responses. (A) Representative plots of CD69+Tbet+ (left panels) and CD69+GATA3+ (right panels) CD4 T‐cell. Gating strategy is shown in Supporting Information Fig. 4. Percentage of (B) CD69+Tbet+ (Th1) and (C) CD69+GATA3+ (Th2) cells of the CD4+ T‐cell population. (D) Ratio of Th1 and Th2 cells. Production of (E) IFN‐γ and (F) IL‐4 by co‐cultured T‐cell. The expression of CD4‐PerCp‐Cy5.5, CD69‐FITC, Tbet‐PE‐Cy7, and GATA3‐PE was analyzed by flow cytometry. Results are presented as mean ± SEM, (4 independent experiments (2‐3 donors/experiment) for panel B‐D, (3 independent experiments (1‐2 donors/experiment) for panel E,F). *p < 0.05, **p < 0.01, paired Student's t‐test.