Figure 1.

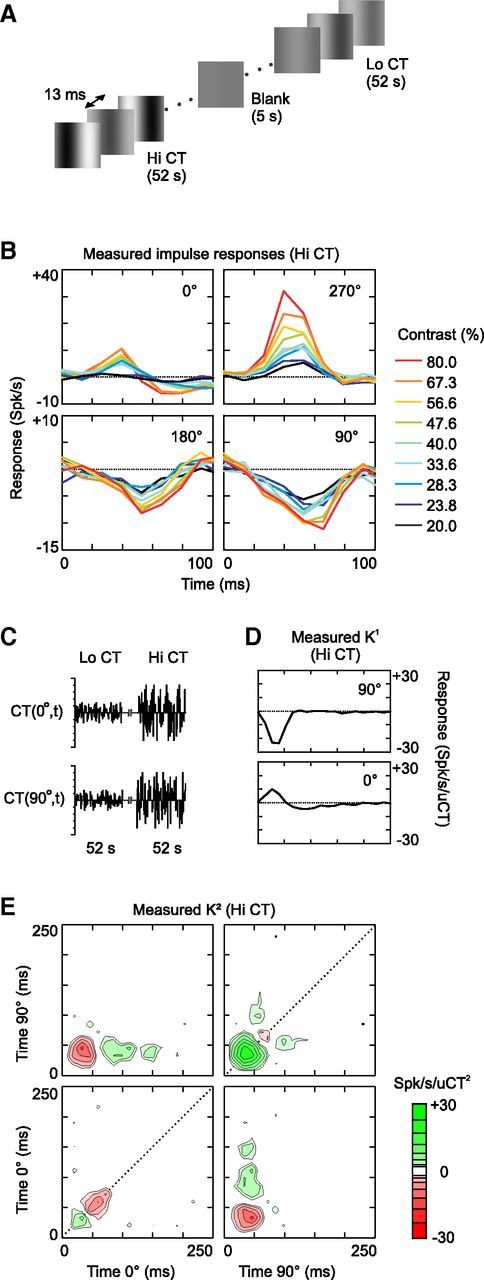
First- and second-order analysis of contrast suppression at Hi CT (cell 1). A, The stimulus was a dynamic sequence of optimal gratings, the spatial phase and contrast of which changed randomly at the screen refresh rate (76 Hz). The range of contrasts presented varied across 52-s-long blocks: in the Hi CT condition, the contrast varied between 20% and 80%; in the Lo CT condition, the contrast varied between 7.07% and 28.28%. B, Impulse responses to each of the 36 combinations of contrast and phase presented in the Hi CT condition. Only the dynamic section (first 100 ms) of the 250-ms-long impulse responses is shown. Each panel contains all of the impulse responses reconstructed at a given spatial phase. The color (see figure key) of the impulse responses indicates the contrast of the corresponding frame. The baseline (K0 = 10.7 spikes/s) is indicated by the dotted line. C, The stimulus sequence can also be represented by two variables CT(0°,t) and CT(90°,t), corresponding to the contrasts presented at spatial phases 0° and 90° (positive values) and 180° and 270° (negative values). D, K1 of cell 1 at Hi CT in the 2D stimulus space described in C. E, K2 of cell 1 at Hi CT. The K2 is arranged in four quadrants corresponding to the four possible phase combinations (clockwise from top left: 0°/90°, 90°/90°, 90°/0°, and 0°/0°, respectively). The x-axis and y-axis specify the delays (from the gratings onsets) after which a particular interaction is observed or, equivalently, the time at which each grating was flashed before the response at time zero. The z-axis (color scale) measures the strength and polarity of the interaction, in units of spikes per second per square unit contrast; note that a logarithmic color scale was used to represent the large dynamic range of the K2. The K2 diagonals are indicated by dotted lines.
