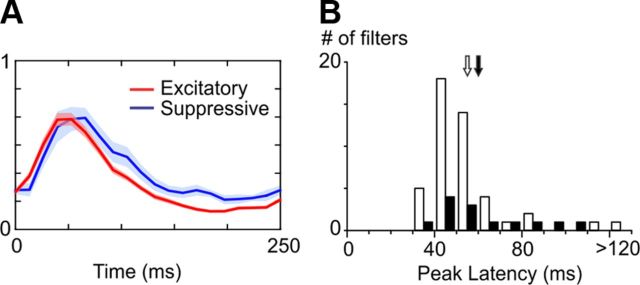
Figure 10.
Dynamics of the significant excitatory and suppressive filters at Lo CT. A, Average temporal envelopes of the excitatory (red) and suppressive (blue) filters at Lo CT (shaded areas indicate ± 1 SEM). B, Histogram of the peak latencies of the excitatory (white bars) and suppressive (black bars) filter envelopes at Lo CT. Arrows indicate the means of the two distributions (white: excitatory filters, black: suppressive filters).

