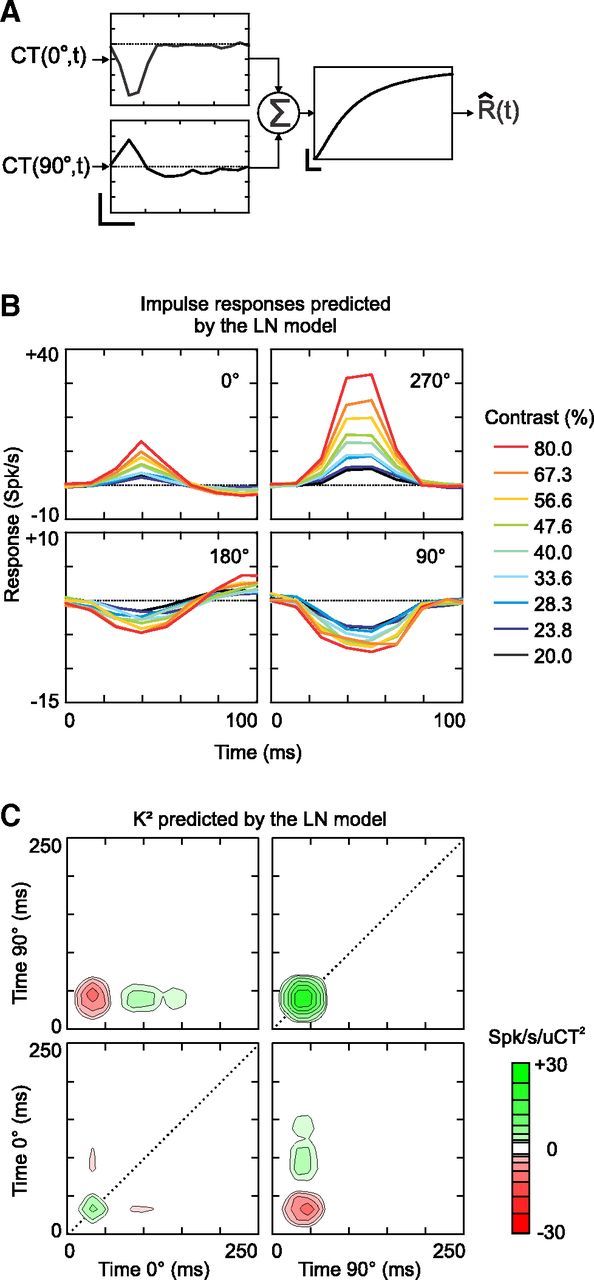
Figure 2.

First- and second-order analysis of the response predicted by the LN model of cell 1. A, LN-model of cell 1 in the Hi CT condition. The LN-model consists of two 1D filters receiving the contrast inputs CT(0°,t) and CT(90°,t) (vertical scale bar: 2 spikes/s/uCT; horizontal scale bar: 50 ms), followed by a sigmoid static nonlinearity (vertical scale bar: 100 spikes/s; horizontal scale bar: 1 spikes/s). This nonlinearity corresponds to Equation 3 with parameters α = 0.43, β = 122, γ = 0.26, and ζ = 0.73. B, Impulse responses predicted by the LN model. The impulse responses were computed by solving Equation 1 using the response predicted by the LN model. C, K2 predicted by the LN model.
