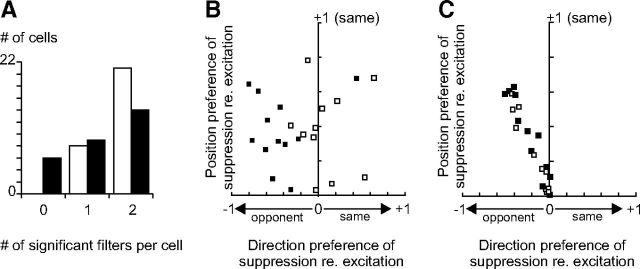
Figure 5.
Spatiotemporal tuning of the significant excitatory and suppressive filters at Hi CT. A, Histogram of the number of excitatory (white bars) and suppressive (black bars) significant filters per cell at Hi CT. B, Direction and position preference of suppression relative to excitation. Vertical axis: Correlation coefficient (Pearson's r) between the position-specific terms of the excitatory and suppressive K2 (position K2, see Materials and Methods). Horizontal axis: Correlation coefficient between the motion-specific terms of the excitatory and suppressive K2 (motion K2). Open squares indicate non-direction-selective cells having a DSI <0.6; solid squares, direction-selective cells having a DSI >0.6. C, Same as B, except that the fourth step of the multi-LN model fitting (joint refitting of the linear and nonlinear parameters) was omitted. The motion K2 of excitation and suppression are now systematically anticorrelated.

