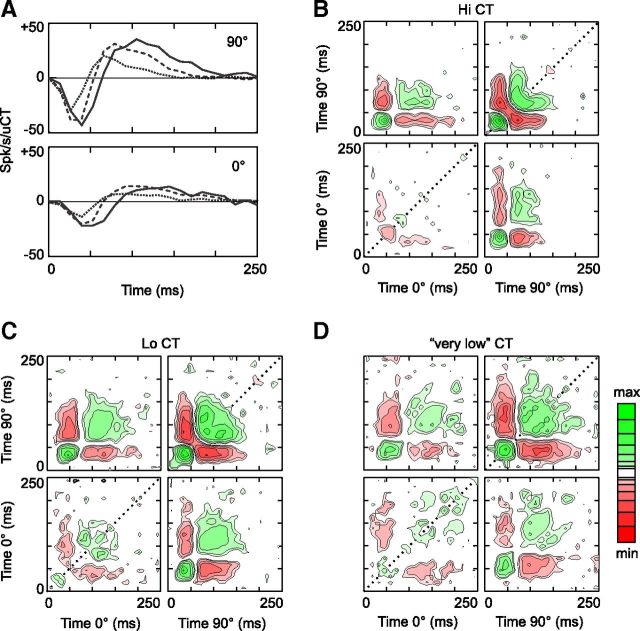
Figure 8.
K1 and K2 measured in three adaptation conditions (cell 3). A, K1 measured at Hi CT (contrasts ranging from 20% to 80%, dotted line), Lo CT (contrasts ranging from 7% to 28%, dashed line), and very low contrasts (contrasts ranging from 2.5% to 10%, solid line). B–D, K2 measured at high, low, and very low contrasts, respectively. The maximum/minimums of the color scale are ±30, ±120, and ±480 spikes/s/uCT2 in B, C, and D, respectively.

