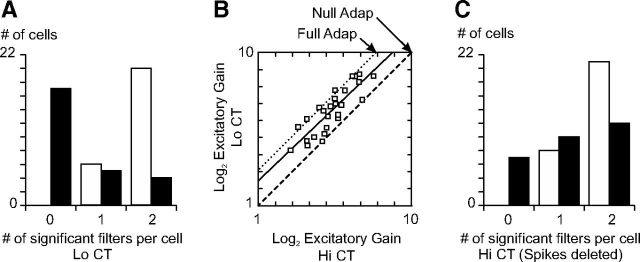
Figure 9.
Change in the excitation/inhibition balance across adaptation conditions. A, Histogram of the number of excitatory (white bars) and suppressive (black bars) significant filters per cell at Lo CT. B, Graph of the log2 excitatory gain at Hi CT versus log2 excitatory gain at Lo CT. The solid line is the best-fitting straight line (slope: 0.956, y-intercept: 1.50). The dashed line corresponds to no change in gain (null adaptation). The dotted line corresponds to an 8 × increase in gain between Hi CT and Lo CT: this is the gain change that would be expected in the case of perfect adaptation given the 1.5 octave difference in contrast between the two conditions and the squaring nonlinearities of the multi-LN model, as shown in Equation 5. C, Histogram of the number of excitatory (white bars) and suppressive (black bars) significant filters per cell at Hi CT after randomly deleting spikes to match the number of spikes recorded at Lo CT.

