
Figure 2.
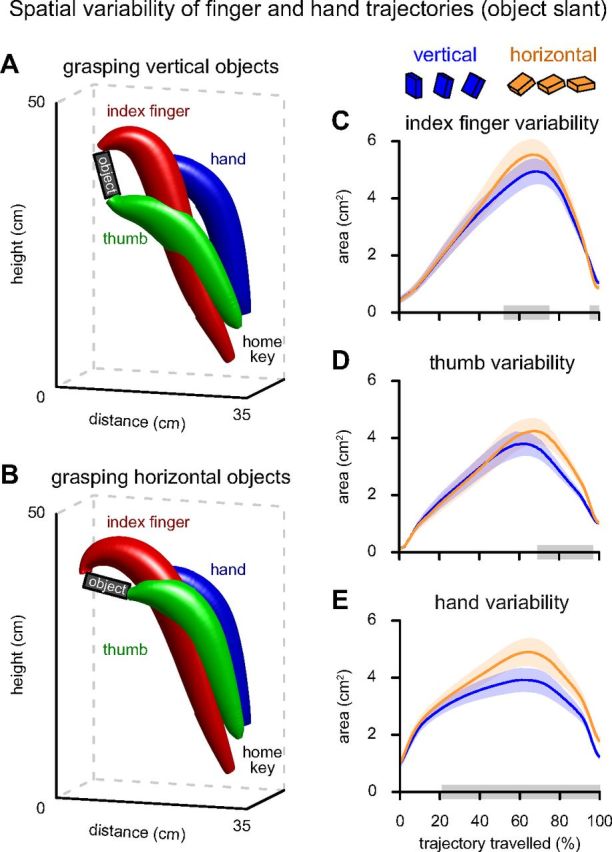
Spatial variability of hand and finger trajectories as a function of object slant. A, B, 3D representations of the effect of object slant (during control sessions) on the shape of the 95% confidence interval of the trajectories of the index finger (red), thumb (green), and hand (blue). The confidence trajectories are calculated for each object configuration separately, but binned in two levels (A, vertical: 0°, 15°, 30°; B, horizontal: 60°, 75°, 90°). C–E, Trajectory dynamics of the tangential area of the 95% confidence intervals when grasping vertical (blue) and horizontal (orange) objects. Shaded areas surrounding the curves represent SEM. Clusters with significant effects of object slant are indicated with gray boxes on the x-axis.