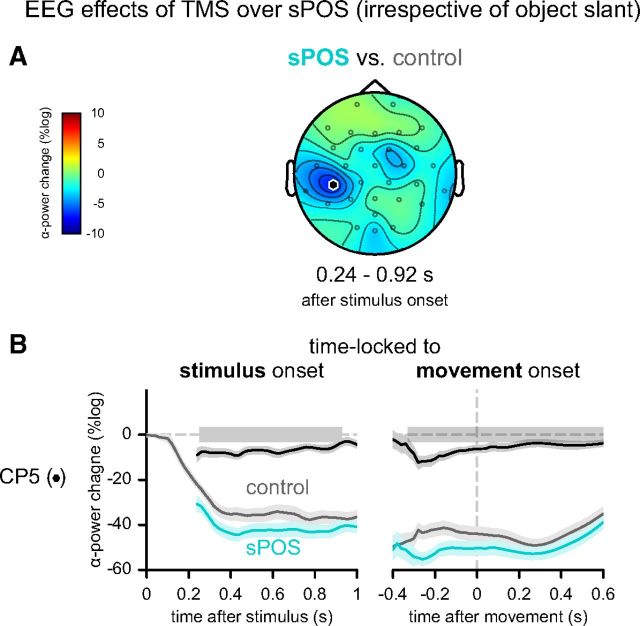
Figure 6.
EEG effects of TMS over sPOS (regardless of object slant). A, Topography of significant differential main effect between sPOS and control stimulation. B, Development of average power in the alpha band over time plotted separately for trials with control (gray) and sPOS (cyan) stimulation. Significant time windows are indicated with gray boxes, relative to stimulus (left panel, [240 920] ms) and movement onset (right panel, [−360 600] ms).

