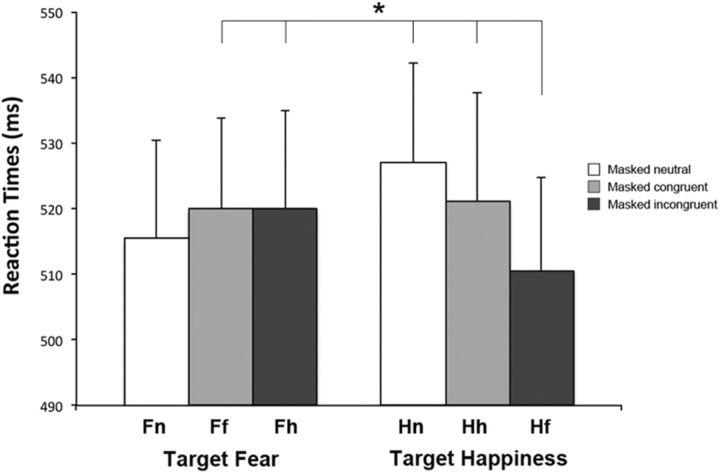
Figure 3.
Experiment 1: Active tDCS over O1. Mean RTs are reported for each condition (neutral, congruent, incongruent) when the targets were fearful faces (columns on the left) and happy faces (columns on the right). Error bars indicate SEM. The asterisk indicates significantly faster RTs in response to a target happy face coupled with a masked fearful face (Hf) compared with Ff, Fh, Hn, and Hh conditions (all ps ≤ 0.05).

