
Figure 2.
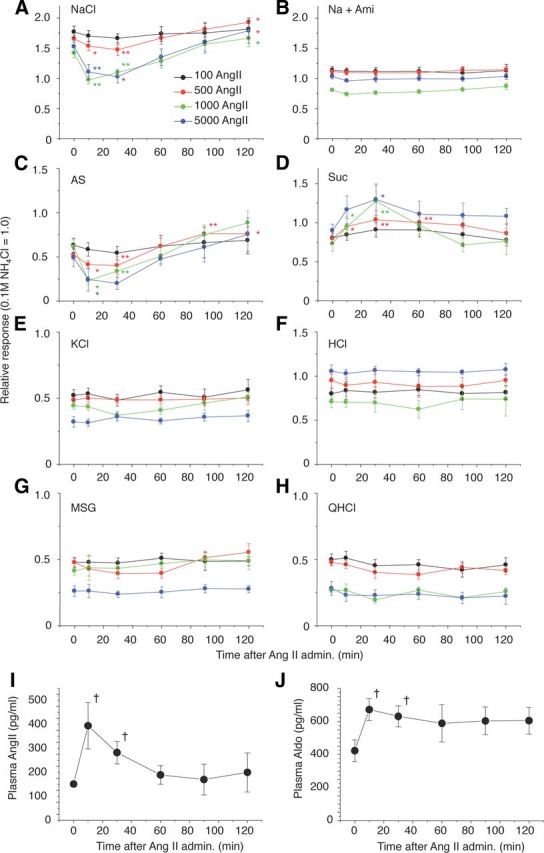
Time-dependent changes in CT nerve responses to (A) 300 mm NaCl; (B) 300 mm NaCl + 30 μm amiloride (Na + Ami); (C) AS (amiloride-sensitive component: obtained by subtracting Na + Ami from NaCl); (D) 500 mm Suc; (E) 100 mm KCl; (F) 10 mm HCl; (G)100 mm MSG + 30Ami (MSG); and (H) 20 mm QHCl 0 and 10, 30, 60, 90, and 120 min after administration of 100–5000 ng/kg bw of AngII in B6 mice. I, J, Time-dependent changes in plasma AngII and Aldo after administration of 5000 ng/kg bw of AngII in B6 mice. Asterisks indicate significant differences from control (0 min) (n = 6–14, *p < 0.05, **p < 0.01; paired t test, †p < 0.05; t test). All data are presented as the mean ± SEM.