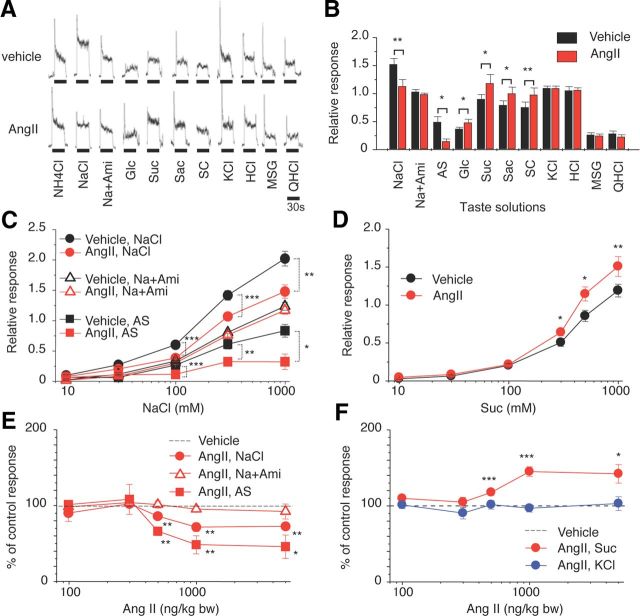
Figure 3.
AngII reduces CT nerve responses to NaCl (amiloride-sensitive component) and enhances responses to sweeteners. A, Typical examples of CT nerve responses of B6 mice 30 min after intraperitoneal injection of 1000 ng/kg bw of AngII (lower traces) versus vehicle-injected controls (upper traces). B, CT nerve responses (normalized to 100 mm NH4Cl) of B6 mice stimulated by indicated compounds 10–30 min after administration of vehicle (black bars) or 1000 ng/kg bw of AngII (red bars) (n = 7–17). Compounds tested: NaCl [300 mm NaCl]; Na + Ami [300 mm NaCl + 30 μm amiloride]; AS, the amiloride-sensitive NaCl component (obtained by subtracting Na + Ami from NaCl); Glc [500 mm glucose]; Suc [500 mm sucrose]; Sac [20 mm saccharin]; SC [1 mm SC45647]; KCl [100 mm KCl]; HCl [10 mm HCl]; MSG [100 mm monosodium glutamate + 30 Ami]; and QHCl [20 mm quinine HCl]. C, Concentration dependence of CT responses to NaCl, NaCl + Ami, and AS 10–30 min after administration of vehicle (black symbols) or 1000 ng/kg bw of AngII (red symbols) (n = 5–12). D, Concentration-dependent CT responses to sucrose 10–30 min after administration of vehicle (black symbols) or 1000 ng /kg bw of AngII (red symbols) (n = 12). E, Dose-dependent effect of AngII treatment on CT responses to 300 mm NaCl, 300 mm Na + 30 μm Ami, and 300 mm AS (n = 6–13; see Fig. 2 for details) (in each case the response magnitude to 300 mm NaCl, 300 mm Na + 30 μm Ami, or 300 mm AS after administration of vehicle control were normalized to be 100%). F, Dose-dependent effect of AngII treatment on CT nerve responses to 500 mm Suc and 100 mm KCl (n = 7–15) (in both cases the response magnitude to 500 mm Suc or 100 mm KCl after administration of vehicle control were normalized to be 100%). Asterisks indicate significant differences between AngII treatments and vehicle controls [*p < 0.05; **p < 0.01; ***p < 0.001; paired t test (B), post hoc t test following repeated two-way ANOVA (C–F)]. All data are presented as the mean ± SEM.

