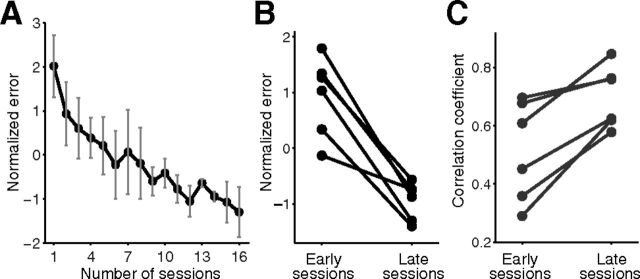
Figure 4.
A, The average (error bars indicate SDs) tracking error as the number of sessions performed in the practice sessions. B, The average tracking error of first and last three practice sessions. C, Maximal cross-correlation between trajectories of target and those of cursor averaged during first and last three sessions. Each dot represents the results of an individual participant (n = 6).

