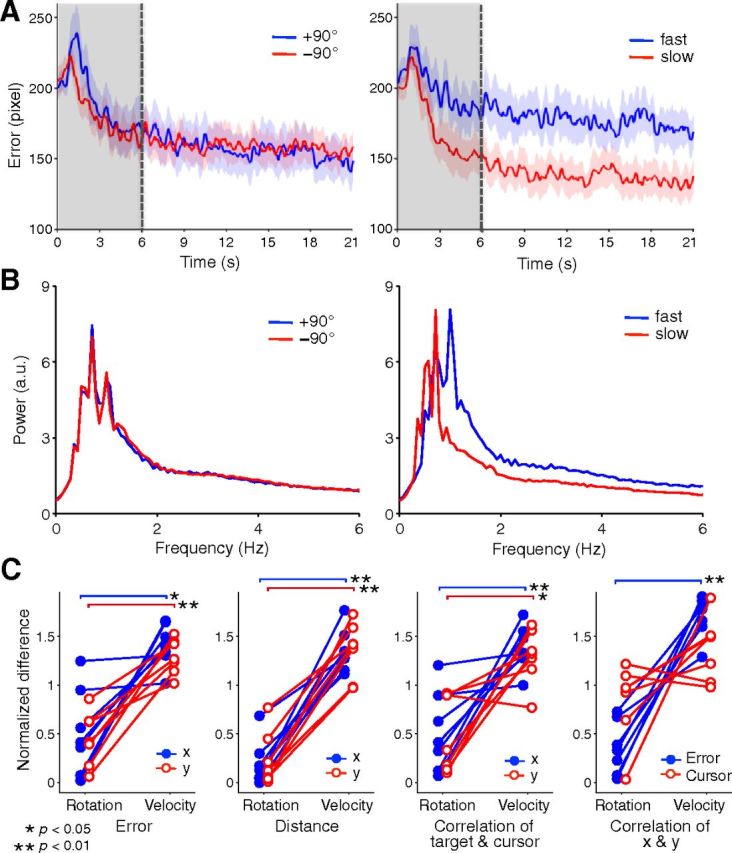
Figure 5.

Behavioral results during fMRI scanning. A, Time series of mean tracking error within block. Two rotation and velocity types were compared in left and right figures, respectively. Trial onset of 6 s (gray areas) was removed for later analysis. Shaded region with colors denotes SD across subjects. B, Power spectrum of cursor trajectory averaged over trials and two dimensions during fMRI scanning. Two rotation and velocity types were compared in left and right figure, respectively. C, The comparisons of behavioral measures between rotation and velocity types.
