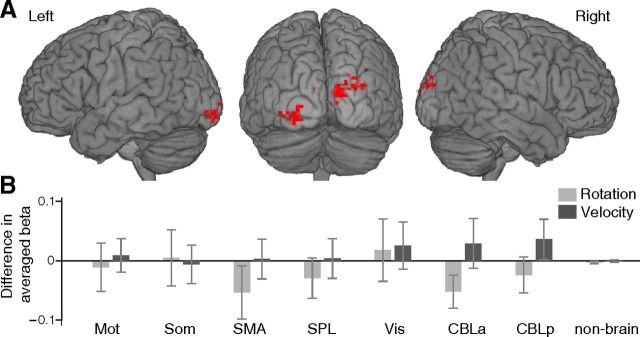
Figure 6.
Mass-univariate fMRI results. A, The areas with a significant main effect of velocity types at p < 0.01 uncorrected for multiple comparisons with an extent of 10 voxels. B, ROI analysis comparing averaged parameter estimates (β values) between two conditions of rotation and velocity within each ROI. Error bars indicate SEMs. Abbreviations are as defined in Figure 2 legend.

