
Figure 7.
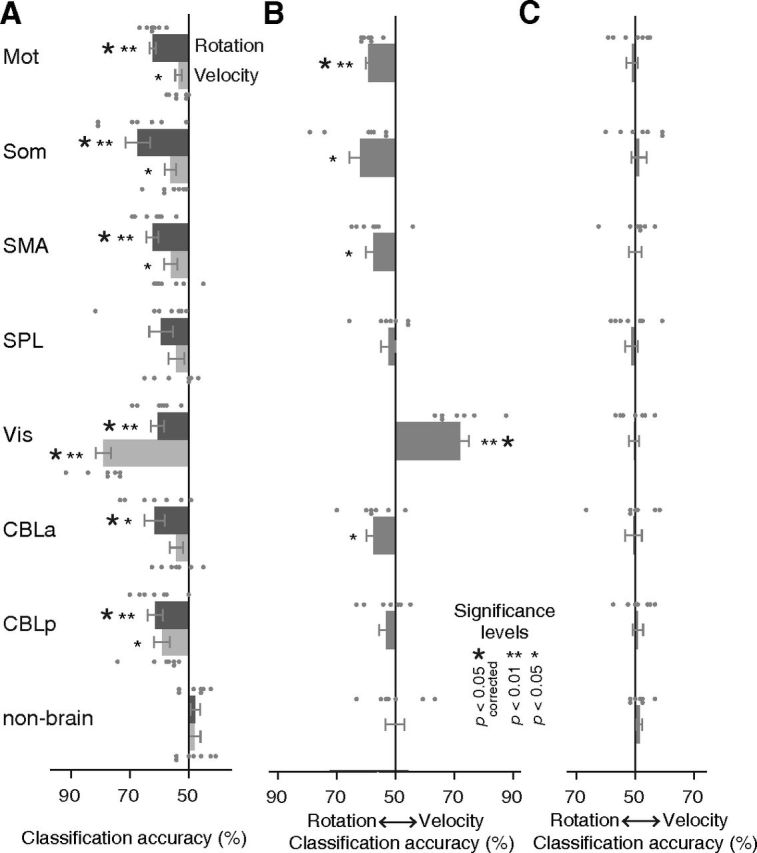
MVPA results. A, Averaged classification accuracy of rotation types or velocity types with cross-validation among different velocity or rotation conditions (Fig. 3A). B, Averaged classification accuracy of “cross-classification” with different combinations of rotation and velocity types (Fig. 3B). C, The result of the same analysis as B except using the averaged activation within ROIs. Error bars and small dots indicate SEMs and individual result of subjects (n = 7), respectively. Small and large asterisks indicate statistical significance of p values uncorrected and corrected for multiple comparisons using Holm–Bonferroni procedure. Abbreviations are as defined in the Figure 2 legend.