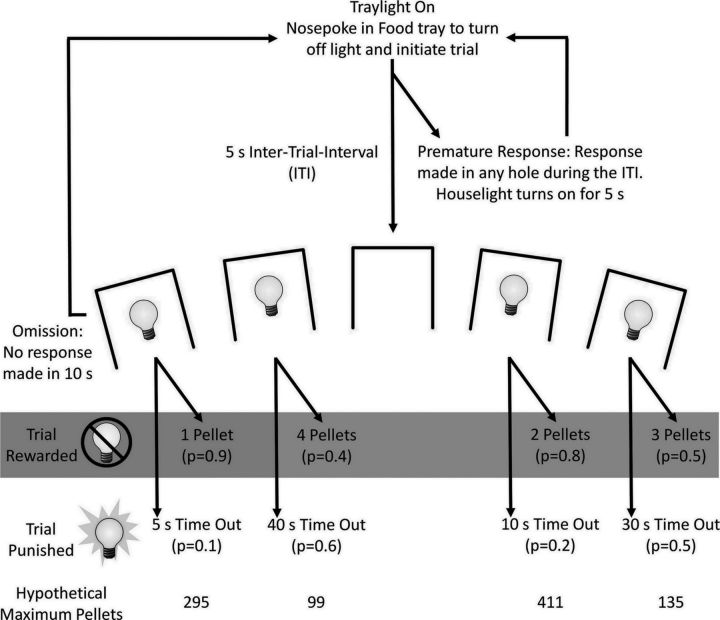
Figure 1.
Diagram showing the trial structure of the rGT. The task began with illumination of the tray light. A nose-poke response in the food tray initiated a new trial. After an ITI of 5 s, 4 stimulus lights were turned on in holes 1, 2, 4, and 5, and the animal was required to respond in 1 of these holes within 10 s. This response was then rewarded or punished depending on the reinforcement schedule for that option. The p values refer to the probability of a trial resulting in reward or a punishing time-out period. The reward magnitude or duration of the time-out period is indicated beside each option. If the animal was rewarded, the stimulus lights were extinguished and the animal received the corresponding number of pellets in the now-illuminated food tray. If the animal was punished, the stimulus light in the corresponding hole flashed at a frequency of 0.5 Hz for the duration of the time-out period and all other lights were extinguished. Failure to respond at the illuminated holes resulted in an omission, whereas a response during the ITI was classified as a premature response and punished by a 5 s time-out during which the house light was turned on. The maximum numbers of pellets that could be obtained if an animal chose a single option exclusively within a single session, assuming each trial lasted 5 s, are listed at the bottom of the diagram, indicating that the 2-pellet option, P2, is the best option. Figure is modified from Zeeb et al. (2009) and Zeeb and Winstanley (2011).

