
Figure 1.
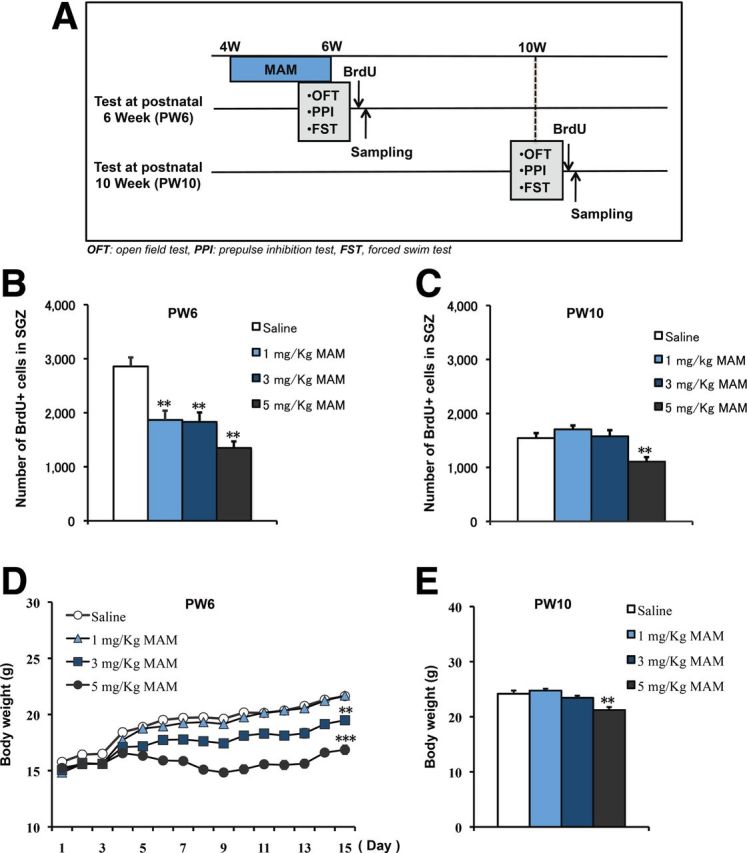
Decrease in newborn cell proliferation at PW6 by MAM treatment and rescue at PW10. A, Experimental design for MAM treatment and behavioral tests. B, ANOVA analysis revealed a significant decrease in newborn cell numbers in a dose-dependent manner immediately after 2 week MAM treatment (F(3,28) = 15.58428, p < 0.0001, n = 8 mice for each group). C, Rescue of new cell proliferation was observed 4 weeks later at PW10 (F(2,21) = 1.88832, p = 0.17614 for 1 mg/kg and 3 mg/kg MAM vs saline control), except for the highest dose of MAM treatment (F(1,14) = 30.96936, p = 0.00007 for 5 mg/kg MAM vs saline control, n = 8 mice for each group). D, MAM treatment induced a dose-dependent change in body weight (repeated ANOVA: F(3,44) = 116.77, p < 0.001; 1-way ANOVA at the last day of MAM treatment: F(1,22) = 0.02353, p = 0.87949 for 1 mg/kg MAM vs saline control; F(1,22) = 26.76762, p = 0.00003 for 3 mg/kg MAM vs saline control; F(1,22) = 106.61121, p < 0.0001, n = 12 mice for each group). E, Body weights were recovered by PW10 (F(2,21) = 2.12923, p = 0.14389 at 1 mg/kg and 3 mg/kg MAM vs saline control, n = 8 mice for each group), except for the highest dose of MAM (F(1,14) = 13.92006, p = 0.00224 for 5 mg/kg MAM vs saline control, n = 8 mice for each group). *p < 0.05; **p < 0.01.