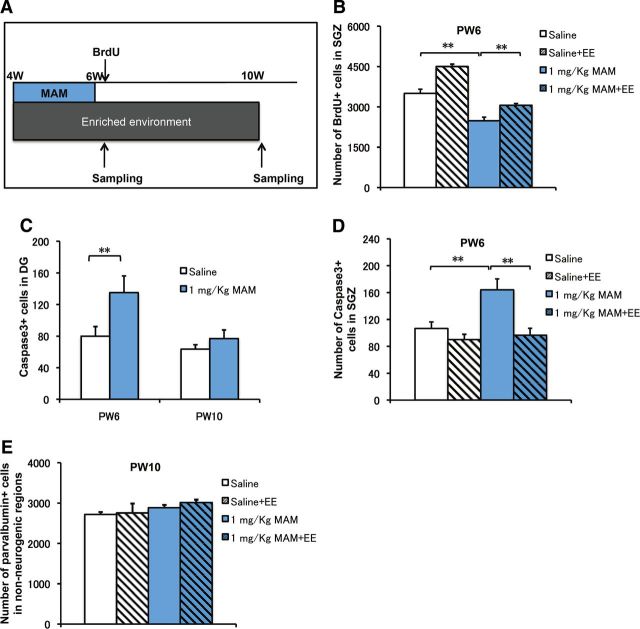
Figure 10.
The effect of EE application on the proliferation of newborn cells and MAM-induced cell death. A, Experimental design for MAM treatment, EE application during PW4–PW10, BrdU injection, and cellular analysis. B, Cell proliferation in the DG, which was indicated by one pulse of BrdU incorporation (50 mg/kg) 2 h before sampling, was significantly decreased by MAM treatment (blue bar) compared with the saline group (open bar) (F(1,10) = 24.94531, p = 0.00054 for MAM vs saline, n = 6 for each group). EE application increased the number of BrdU+ cells compared with MAM treatment (F(1,10) = 17.49274, p = 0.00127 for MAM vs saline, n = 6 for saline and n = 8 for MAM group). C, Consistently, the number of caspase3+ cells was increased immediately after MAM treatment at PW6 (F(1,10) = 5.09431, p = 0.04761 for MAM vs saline, n = 6 for each group) and returned to the control level at PW10 (F(1,10) = 1.17259, p = 0.30429 for MAM vs saline, n = 6 for each group) after a 4 week withdrawal from MAM treatment. D, EE application from PW4 to PW6 effectively restored the number of caspase3+ cells to the control level at PW6 (F(1,14) = 12.2023, p = 0.00358 for MAM vs saline, n = 8 samples for each group). E, There were no differences in the numbers of PV+ cells in non-neurogenic regions between the saline and MAM groups or between the MAM and MAM with EE application groups at PW10 (F(3,28) = 1.08798, p = 0.37037 for MAM vs saline, n = 8 samples for each group). *p < 0.05; **p < 0.01.

