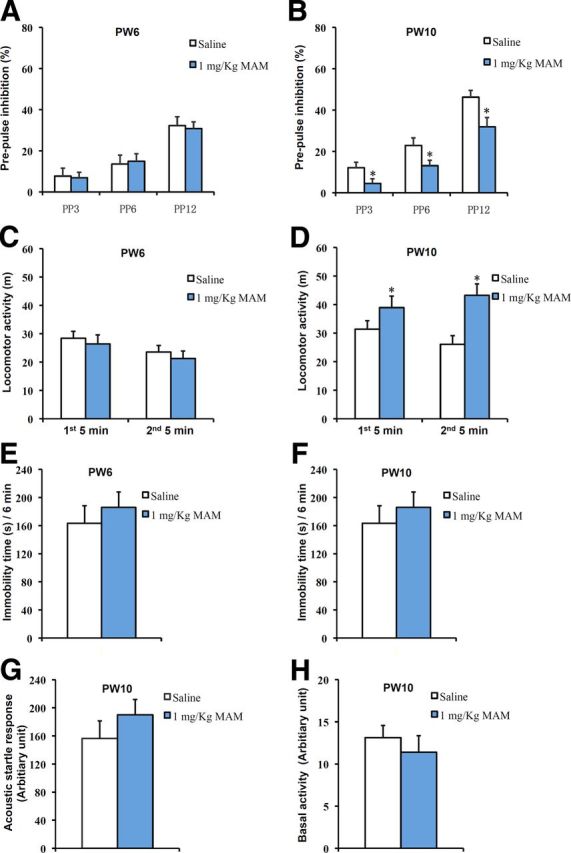
Figure 2.

PPI deficiency and increased spontaneous hyperactivity were observed at PW10 but not at PW6 in MAM-treated mice. A, The PPI scores were not different between the saline-treated and MAM-treated groups at PW6 (2-way ANOVA with group treatment and prepulse intensity: F(2,42) = 0.0904, p = 0.914; 1-way ANOVA with PP3: F(1,14) = 0.02919, p = 0.86678; PP6: F(1,14) = 0.09199, p = 0.76612; PP12: F(1,14) = 0.06947, p = 0.9595 for MAM vs saline, n = 8 for each group). B, PPI deficits were observed at each prepulse intensity level in MAM-treated mice at PW10 (2-way ANOVA with group treatment and prepulse intensity: F(2,42) = 0.561, p = 0.575; 1-way ANOVA with PP3: F(1,14) = 4.76369, p = 0.04659; PP6: F(1,14) = 4.61941, p = 0.04958; PP12: F(1,14) = 6.58918, p = 0.02237 for MAM vs saline, n = 8 for each group). C, There was no change in spontaneous activity between groups at PW6 (first 5 min, F(1,10) = 0.24641, p = 0.63034; second 5 min, F(1,10) = 0.3524, p = 0.56594 for MAM vs saline, n = 6 for each group). D, Spontaneous hyperactivity was observed in the MAM group at PW10 (first 5 min: F(1,12) = 7.45188, p = 0.01827; second 5 min: F(1,12) = 7.6342, p = 0.01718 for MAM vs saline, n = 7 for each group). E, F, During the 6 min forced swimming test, there were no differences in the immobility times (E) between groups at PW6 (F(1,12) = 1.28709, p = 0.29987 for MAM vs saline control, n = 7 for each group) or (F) between groups at PW10 (F(1,16) = 0.68658, p = 0.41952 for MAM vs saline, n = 9 mice for each group). G, There was no difference between the two groups in the acoustic startle response to the startle stimulus at PW10 (F(1,14) = 0.52523, p = 0.48056 for MAM vs saline, n = 8 mice for each group). H, There was no difference between the two groups in the response to the background stimulus at PW10 (F(1,14) = 0.50669, p = 0.48827 for MAM vs saline, n = 8 mice for each group). *p < 0.05 vs saline control.
