
Figure 8.
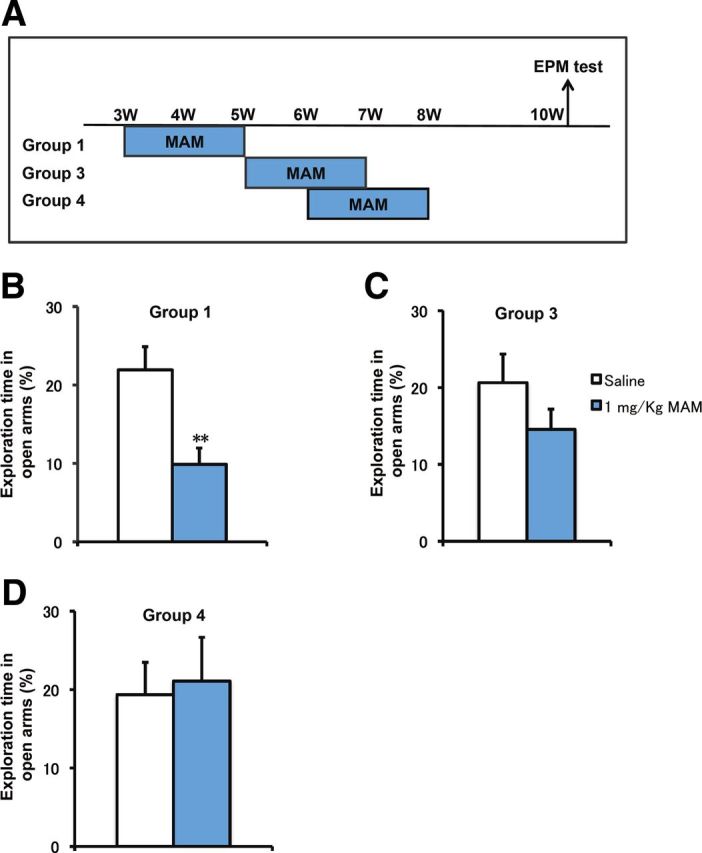
Developmental changes in the elevated plus maze (EPM) test induced by MAM treatment. A, Experimental design for MAM treatment at different periods and EPM testing at PW10. B, Anxiety-like behaviors were observed at PW10 in animals that received MAM treatment during PW3–PW5 (F(1,14) = 11.11031, p = 0.00493 for MAM vs saline, n = 8 for each group). C, D, Mice with MAM treatment at PW5–PW7 (C) and PW6–PW8 (D) showed normal behavioral phenotypes compared with the saline group in the EPM test at PW10 (PW5–PW7: F(1,14) = 1.76874, p = 0.2048; PW6–PW8: F(1,14) = 0.06245, p = 0.80629 for MAM vs saline, n = 8 for each group). *p < 0.05 vs saline control; **p < 0.01 vs saline control.