
Figure 9.
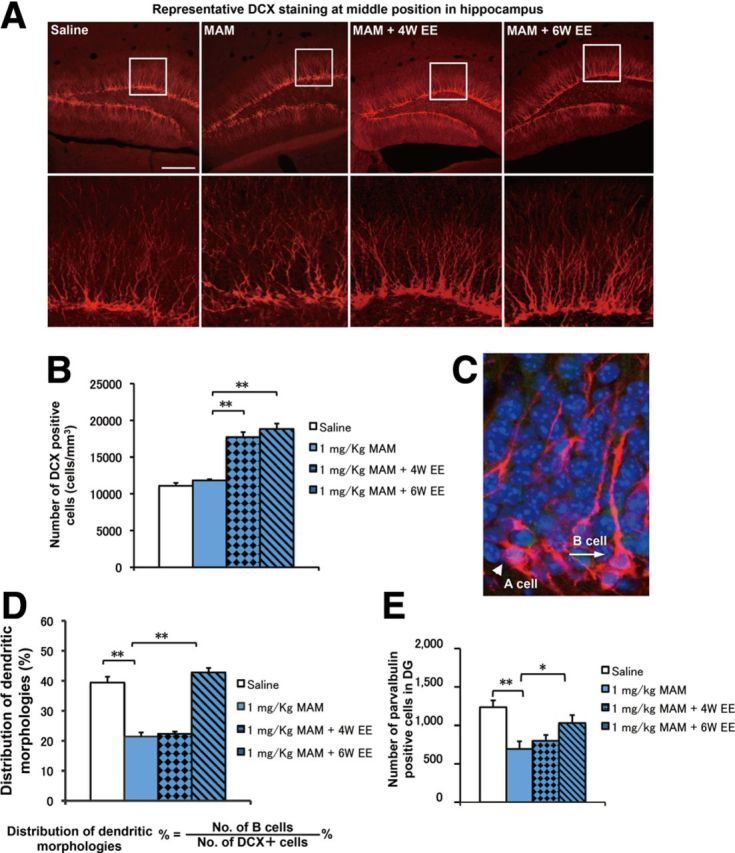
Morphological deficits in DCX+ cells were rescued by EE application in MAM-treated mice. A, Representative DCX staining in the DG in each group. Scale bar, 200 μm. B, The total number of DCX+ cells in the saline (open bar) and MAM (blue bar) groups was comparable in the DG (F(1,14) = 3.0005, p = 0.1052 for MAM vs saline). EE application significantly increased the number of DCX+ cells (F(2,21) = 58.27158, p < 0.001, n = 8 for each group). C, Representative DCX morphology without (category A cell) and with (category B cell) strong vertical processes. D, The proportion of category B cells was significantly decreased in the MAM group (F(1,14) = 80.53699, p < 0.001 for MAM vs saline) but was rescued by a 6 week EE application (F(1,14) = 173.91939, p < 0.001 for MAM plus 6 week EE vs MAM) but not by a 4 week EE application (F(1,14) = 1.89102, p = 0.19069 for MAM plus 4 week EE vs MAM, n = 8 for each group). E, The decrease in the number of PV+ cells was rescued by a 6 week EE application (F(1,14) = 16.87865, p = 0.00106 for MAM vs saline; F(1,14) = 5.56777, p = 0.03335 for MAM vs MAM plus 6 week EE, n = 8 samples for each group) but not by a 4 week EE application (F(1,14) = 0.72633, p = 0.40842 for MAM vs MAM plus 4 week EE, n = 8 for each group). *p < 0.05; **p < 0.01.