
Figure 4.
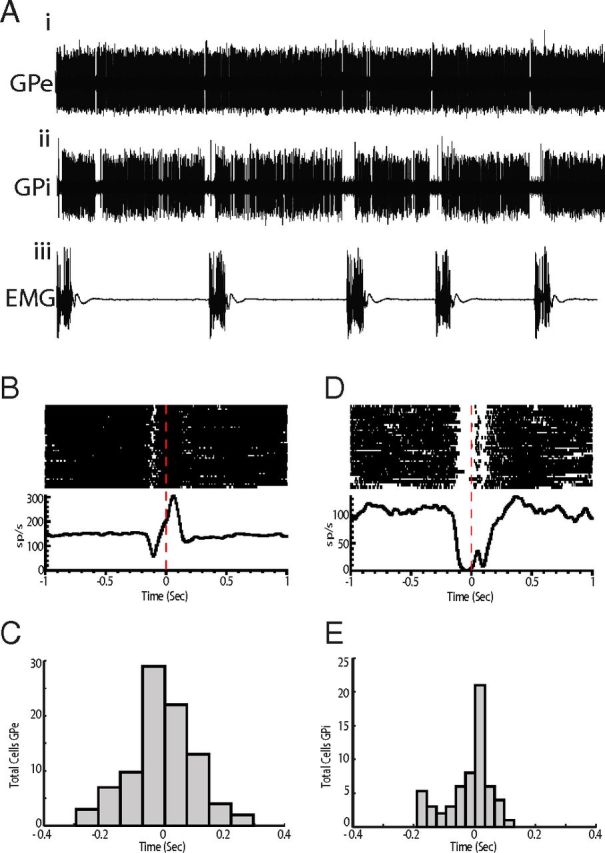
Single-cell recording of pallidal activity during tics. A, Examples of raw data from EMG (Aiii) and simultaneously recorded single cell activity in GPe (Ai) and GPi (Aii) after administration of bicuculline. EMG was recorded from the orofacial region. The large voltage transients are tic events. B, Perievent raster and histogram of the multiphasic GPe cell shown in A. Neuronal activity is aligned to tic onset. C, Histogram representing the distribution of response latencies of GPe neurons relative to tic onset. D, Perievent raster and histogram of the inhibition-type GPi cell shown in A. E, Histogram representing the distribution of response latencies of GPi neurons.