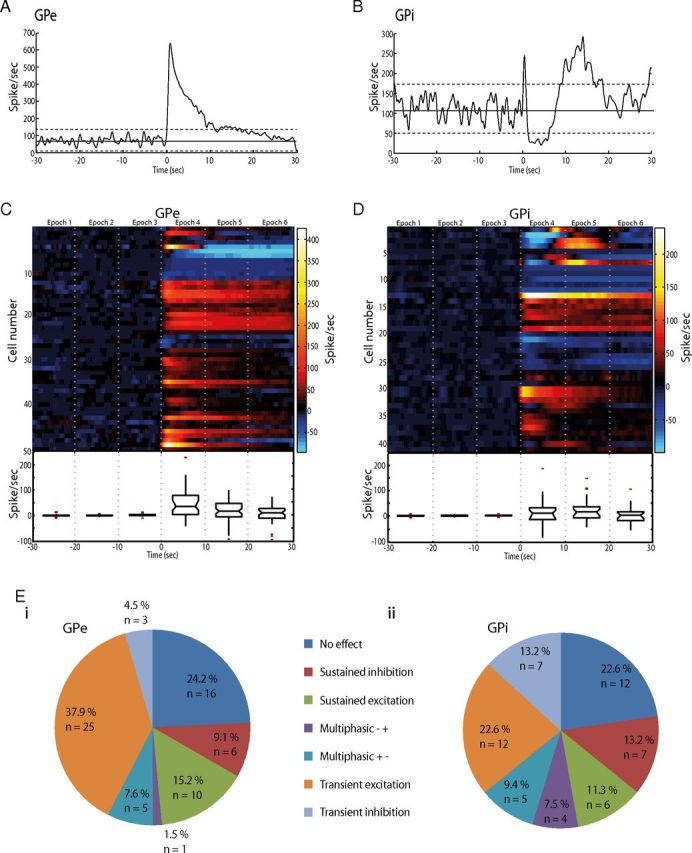
Figure 5.

Long-latency pallidal responses to GPi-HF-DBS. A, Peristimulus histogram aligned to DBS onset (time = 0) for a transiently excited GPe cell. The firing rate returned to control levels while stimulation was still active. B, An example of a GPi cell showing multiphasic changes of firing rates. C, D, Population response to DBS for the GPe (C) and GPi (D). The color matrix showing individual cells discharge is aligned to DBS onset (time = 0). The box-and-whisker plot shows the median and range of HF-DBS induced firing rate changes for each 10 s stimulation epoch before and during stimulation. The horizontal ends of each box indicate upper and lower quartile values; whiskers are extended to the most extreme value 1.5 fold the interquartile range. Notches in the side of the boxes display the 95% confidence interval. Outliers are displayed as +. E, Pie charts indicating the proportion of each type of long-latency effect in GPe (Ei) and GPi (Eii).
