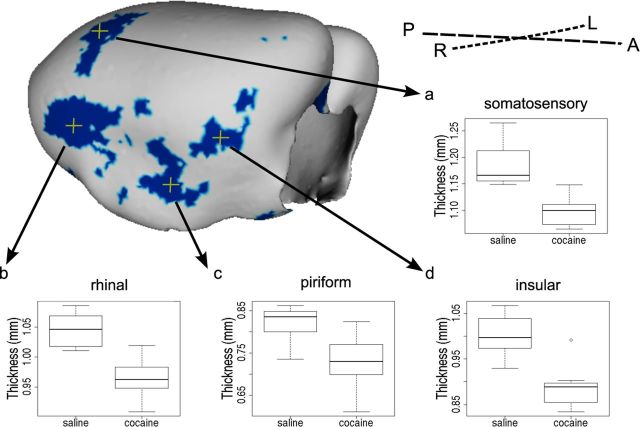
Figure 3.
Cortical surface shows localization of cortical thinning in mice exposed to cocaine during adolescence. Blue color indicates vertices where there is an interaction between age and drug (t > 2.6, 10% FDR) and a difference between cocaine and saline exposure during adolescence (t > 2.6, 10% FDR). The letters A, P, L and R refer to the anterior, posterior, left and right directions in the brain, respectively. Cortical thickness in the adolescent-exposed mice at selected highlighted vertices (yellow crosshairs) are displayed in the box plots (a–d) where the midline represents the median of the data, the box shows the first and third quartiles, and the vertical line represents the range.

