
Figure 2.
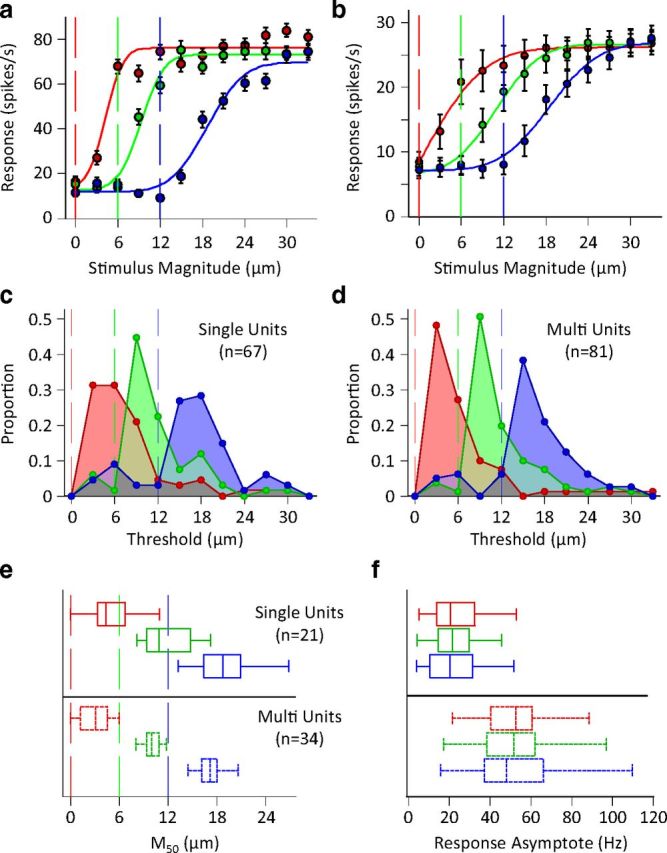
Single unit and population response characteristics in different adaptation states. a, Amplitude response functions of the example neuron from Figure 1. Data points in red indicate response to the test stimulus following no adaptation; points in green and blue indicate response following adaptation to 6 and 12 μm vibration (this convention will be used henceforth). Vertical lines represent the magnitude of the adapting stimulus. Continuous lines represent the best fit of a cumulative Gaussian function to each of the three neuronal response functions. Error bars represent standard error of means across trials. b, Average population response functions. The responses of simultaneously recorded units were averaged to produce a population spike count for individual sessions with a minimum of 5 units. The population spike counts were then averaged across sessions (n = 8). Conventions and fitting are as described in a. Error bars represent the standard error of means across sessions. c, The histogram of the distribution of neuronal thresholds for single units. d, As in c but for clusters of multiunits. e, Distribution of the M50 for single-units (top) and multiunit clusters (bottom). Whiskers of the box plot indicate the extent of the M50 distribution, ends of the boxes represent the upper and lower quartiles, and the bisection line of the boxes indicates the median of the distribution. Vertical lines indicate the magnitude of adapting stimulus. f, Distribution of maximum response rate of fitted cumulative Gaussians for the units in e.