
Figure 3.
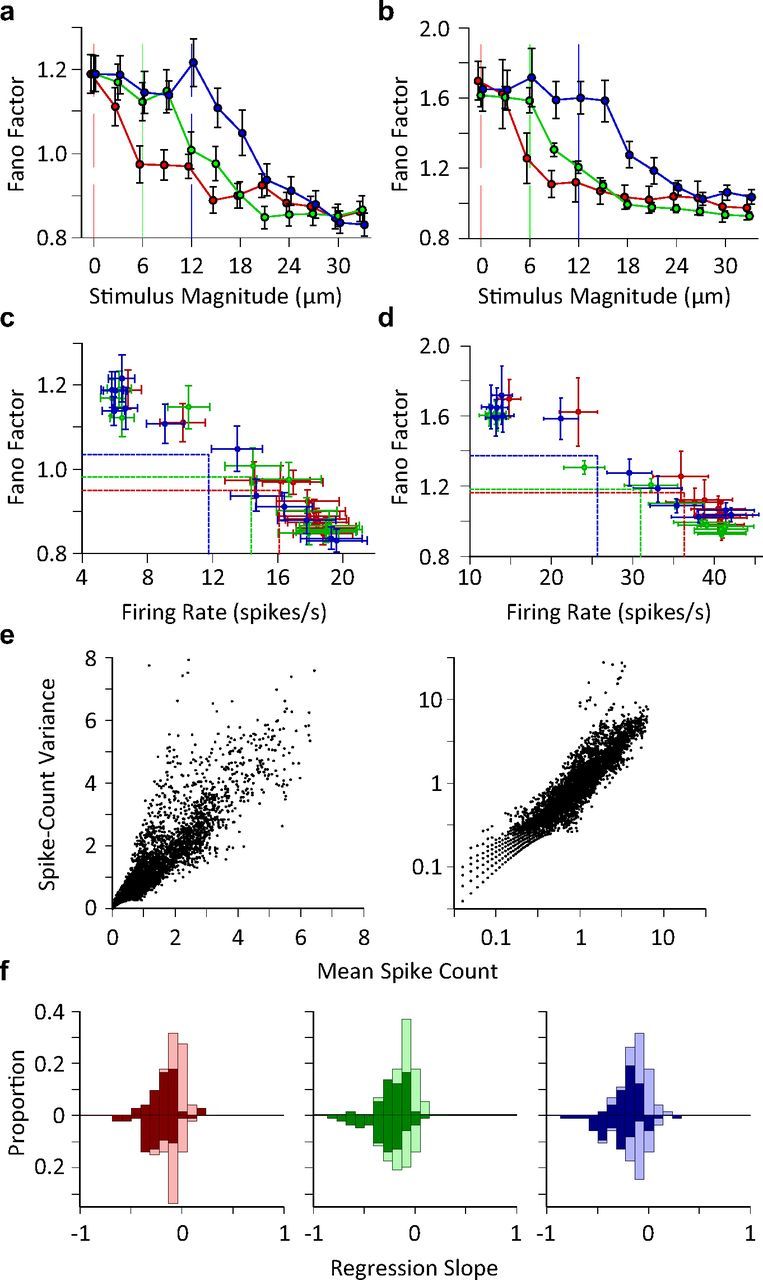
Trial-to-trial variations in neuronal response. a, Single unit Fano factor as a function of stimulus intensity. The plot includes 64 single units as 9 (out of 73) units had zero firing rate in one or more conditions and, consequently, calculating the Fano factor meant division by zero. Each data point represents one stimulus. Error bars indicate standard error of means across neurons. b, as in a but for multiunit clusters (n = 69). c, Fano factor as a function of average firing rate for single neurons. Each data point represents the average Fano factor versus the average firing rate across recordings for a unique stimulus. The horizontal and vertical lines show the mean of average values (center of the distribution of data points) along y- and x-axes for each adaptation state. d, As in c, but for multiunit clusters from b. e, Spike count variance as a function of average spike count. Spike count is calculated over a 50 ms window post stimulus onset. Each data point corresponds to a unique neuron-stimulus-adaptation state triplet. Right panel contains the same data as in the left panel; however, the axes are in logarithmic scale for a clear demonstration of low firing rate regimes. f, The histogram of the linear regression slope of the Fano factor with respect to the z-scored neuronal activity for single units (upward bars) and multiunit clusters (downward bars) separately plotted for every adaptation state. The dark bars correspond to recordings with a significant linear regression (p < 0.05).