
Figure 7.
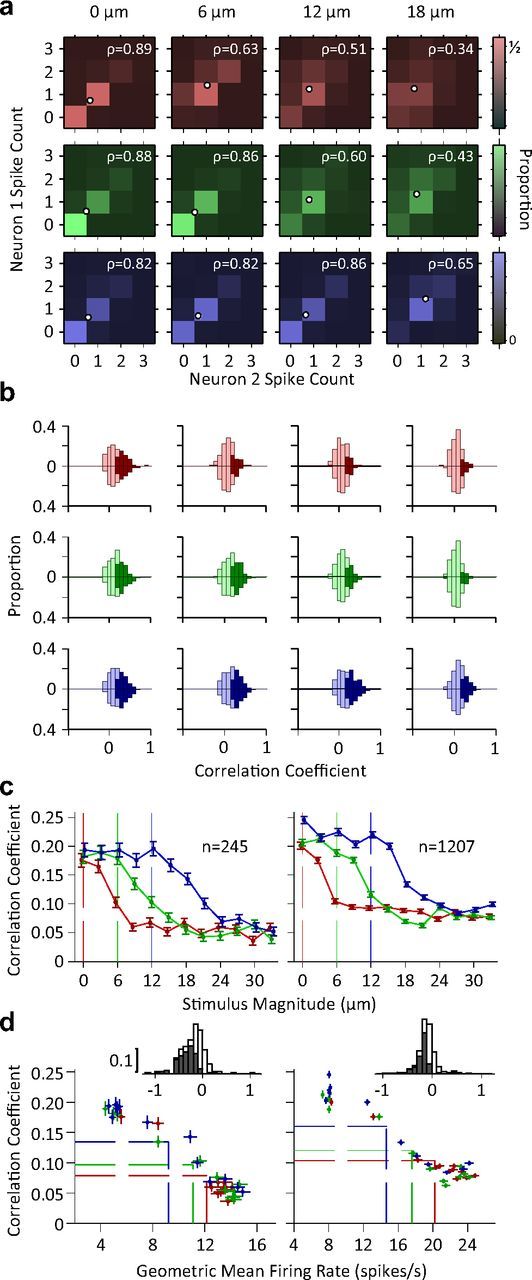
Correlations in variability across pairs of neurons. a, Color indicates the proportion of joint spike counts for a pair of simultaneously recorded single neurons. White circles indicate mean spike counts for each stimulus. The Pearson's correlation coefficient of the spike counts is indicated by ρ for each panel. b, Histogram of pairwise correlation coefficients across all possible simultaneously recorded single unit pairs (n = 245; upward bars) and other neuronal pairs (n = 1207; downward bars). Dark colors indicate correlation coefficients that are significantly different from zero (p < 0.05). c, The mean Pearson's correlation coefficient across all possible pairs of single units (left) and other neuronal recording pairs (right) as a function of stimulus intensity. Error bars indicate standard error of means. d, Pearson's correlation coefficient as a function of geometric mean firing rate of neuronal pairs. Each data point represents average correlation coefficient against geometric mean firing rate averaged across all pairs of simultaneously recorded single neurons (left; n = 245) or averaged across all other possible pairs of recordings excluding pairs of single neurons (right; n = 1207). Every data point represents one stimulus. Dashed lines show the mean of average values (center of the distribution of data points) for each adaptation state. The insets depict the histogram of regression slopes of Pearson's correlation against average firing rate for individual pairs (single unit pairs on the left, other pairs on the right). For each pair, regression analysis was performed across all stimuli and adaptation states. Dark bars indicate the cases that linear regression was significant (p < 0.05).