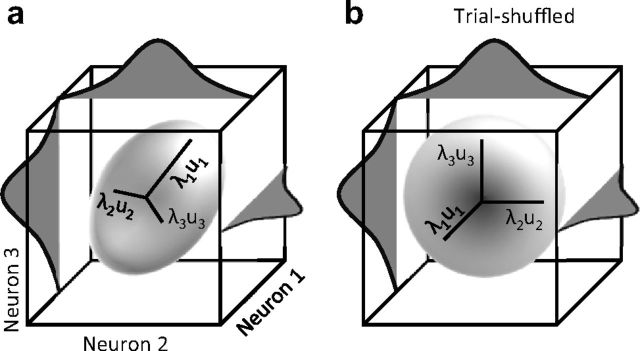
Figure 8.
Schematic illustration of neuronal response covariation for a population of 3 neurons. a, Each dimension represents the z-scored activity of one neuron. The marginal distribution of responses for individual neurons are plotted on their corresponding axes. PCA is used to characterize the shape of the population response distributions in terms of the maximum amount of stretch (highest eigenvalue, λ1) and its direction (first eigenvector, u1). b, Shuffling trial sequence across neurons eliminates the covariation without affecting the marginal distributions.

