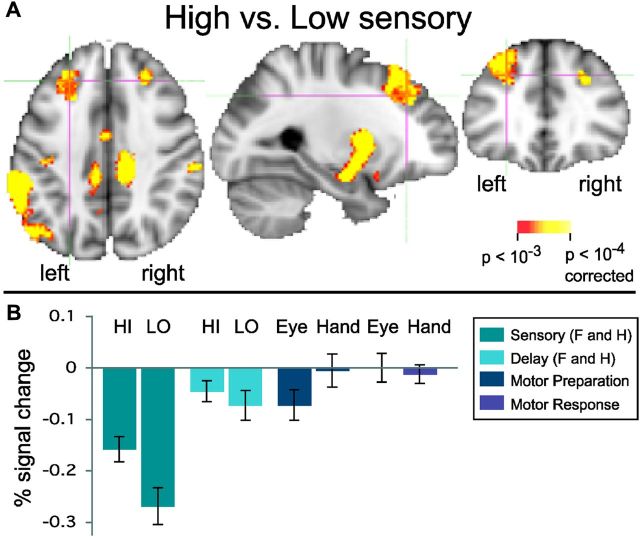
Figure 9.
An SFS area previously identified as posterior DLPFC does not integrate sensory evidence. A, Red to yellow: a region located in the left SFS (see crosshairs) shows significantly greater activation (voxelwise p < 0.0001) for high compared with low sensory evidence (faces and houses). B, A percent BOLD signal change analysis in this region shows that it is deactivated versus fixation baseline during both high and low sensory evidence stimuli. Further, it is not significantly above baseline during other parts of the trial. The positive difference in signal is due to the significantly less negative activation during high compared with low sensory evidence, consistent with previous literature (see Discussion). This region did not increase its effective connectivity with face and house regions during the decision period (Fig. 4). Abbreviations are as in Figure 5 legend.

