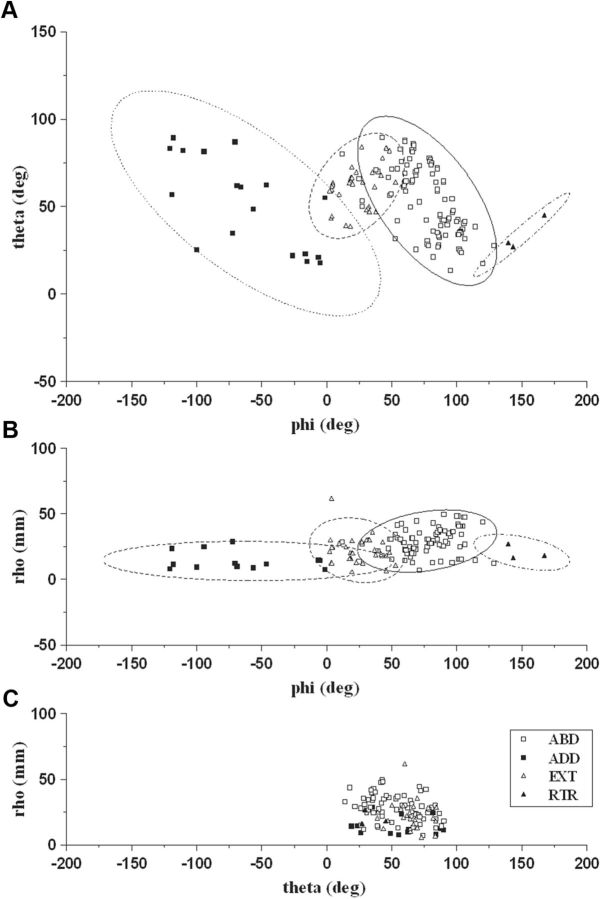
Figure 6.
A–C, Two-dimensional scatter plot of spherical coordinates showing the movement endpoint locations across animals. Since ELV was only vertically upward on the Z-axis (maximal displacement in X- and Y-axes, <4 mm), it was not displayed in these plots. Individual data were represented by a symbol in 2D space, where axes represent the variables (A, phi vs theta; B, phi vs rho; C, theta vs rho). Plots A and B visualized the movement endpoints as a cluster of points highlighted by the confidence ellipsoids (95% confidence limits).

