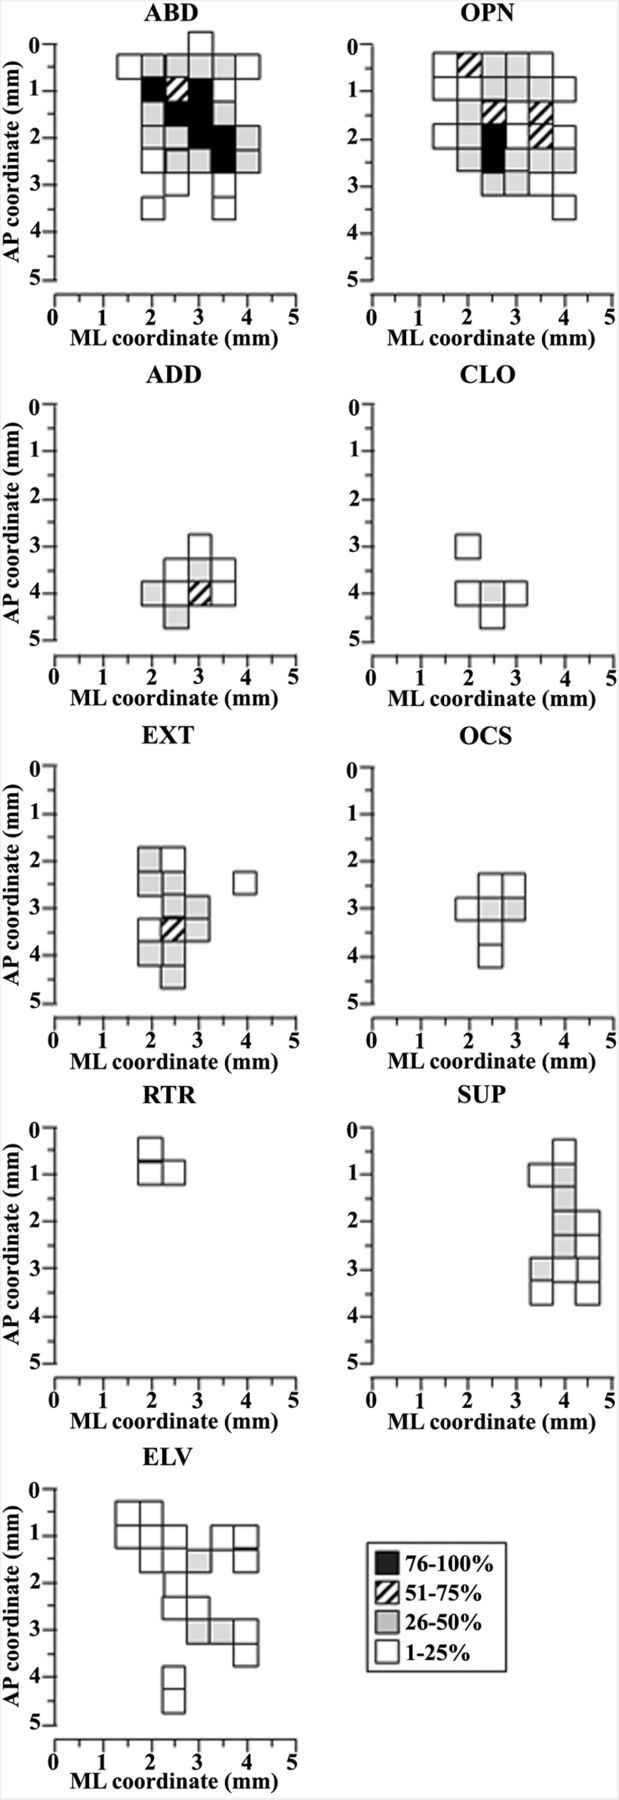
Figure 9.

Description of limb and paw movements according to the distribution of sites across the cortical surface. Surface plots show the frequency distribution of sites at each coordinate relative to the bregma. Interpenetration distances were 500 μm. The microelectrode was sequentially introduced to a depth of 1500 μm, and movements were evoked with stimulation intensity of 100 μA. In this M1 mapping scheme, the frontal pole was at the bottom and 0 corresponded to the bregma; numbers indicated rostral or caudal distance from the bregma or lateral distance from the midline (ML). The frequency movement at each site is coded by different gray levels. One hundred percent probability is achieved when a movement at that site was observed in all seven animals. Left column, Limb movement classes, animal n = 7, sites n = 177. Right column, Paw movement classes, animal n = 7, sites n = 124.
