
Figure 2.
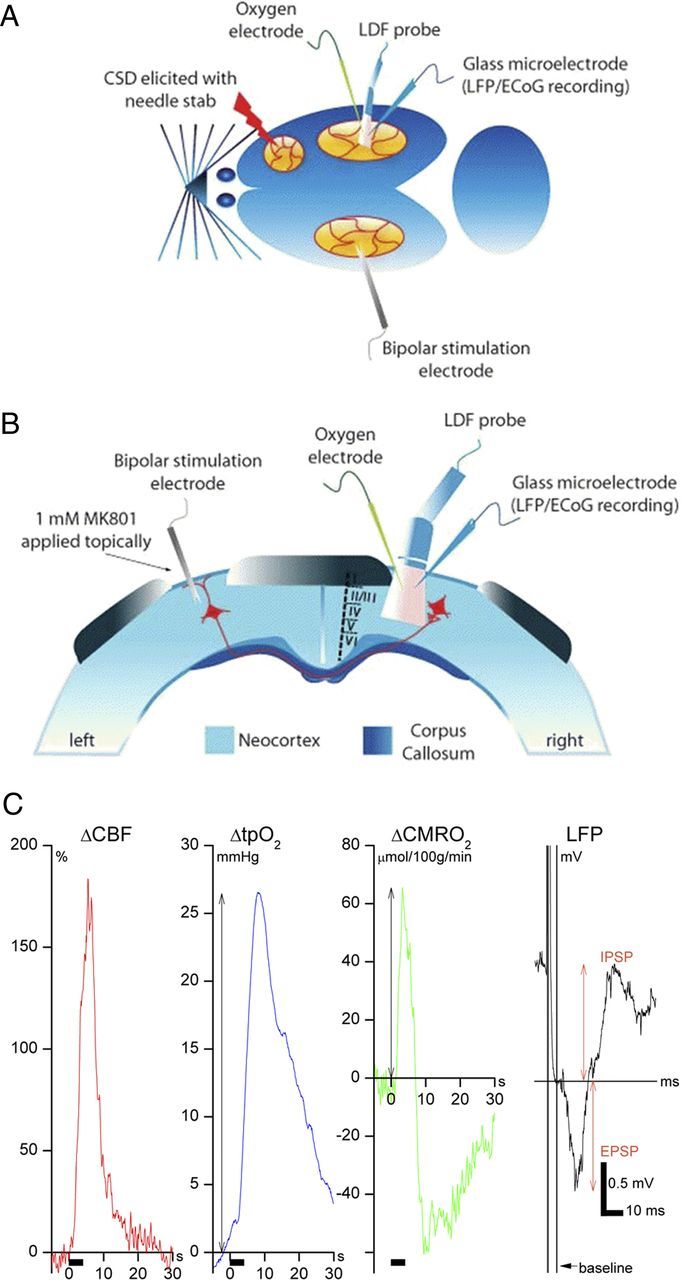
Experimental design. A, Rat brain viewed from above. CSD was elicited in the right frontal cortex with a brief needle stab and propagated into the right somatosensory cortex, monitored by a glass microelectrode recording ECoG activity. Using the same microelectrode, we recorded LFPs evoked by a bipolar stimulation electrode placed in the left somatosensory cortex. Baseline and evoked changes in CBF were recorded by LDF, whereas tpO2 was recorded using a Clark-type polarographic glass microelectrode. B, Rat brain in coronal section. The cortical surface of the stimulation side was superfused with 1 mm MK801 (NMDA receptor blocker) to avoid generation of seizure activity and CSD in that hemisphere, which was produced by placement of the stimulation electrode and transcallosal stimulation (Hoffmeyer et al., 2007). C, Evoked CBF responses were defined as the area under the curve, whereas tpO2 and CMRO2 responses were defined as peak amplitudes from stimulation onset to 20 s later. LFP recordings were EPSPs, defined as a negative peak amplitude, and IPSPs, defined as the positive peak amplitude. All evoked responses were normalized to the pre-CSD value for 20 or 30 Hz stimulation within each animal.