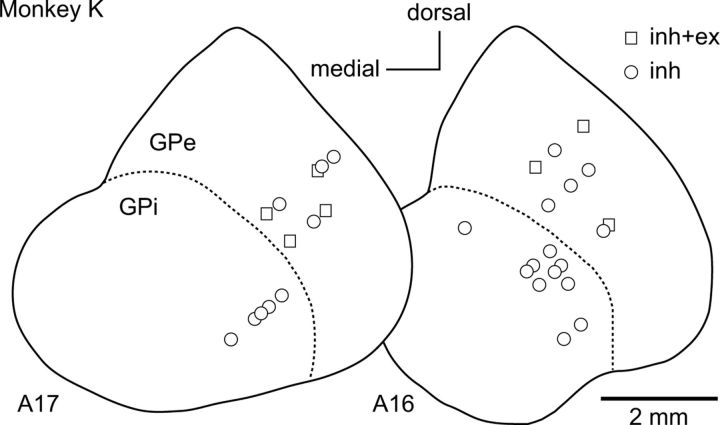
Figure 12.
Distribution of recorded GPi/GPe neurons in a monkey. Locations of GPi/GPe neurons are indicated by different symbols based on response patterns evoked by local repetitive high-frequency stimulation in frontal sections. The distance of the sections from the auditory meatus is shown in millimeters beneath each section. inh, Inhibition; inh+ex, mixed responses composed of inhibition and excitation.

