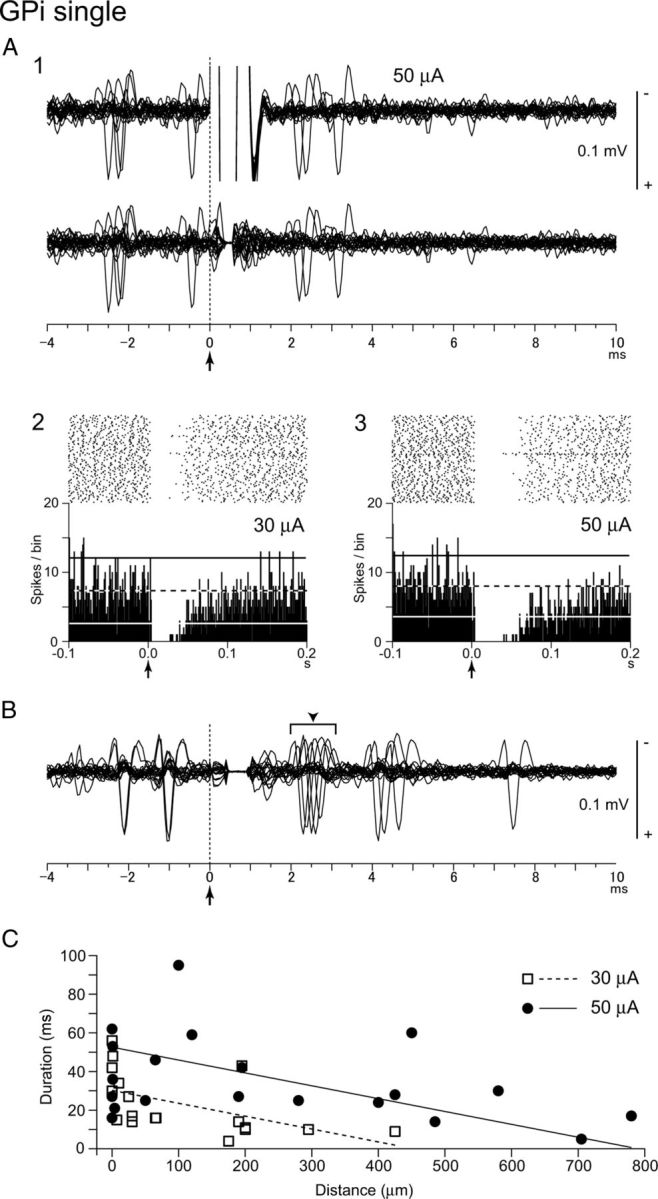
Figure 2.

Responses of GPi neurons to local GPi single-pulse microstimulation. A1, Raw traces of a GPi neuron before (top) and after (bottom) removing the stimulus artifacts by the template subtraction method. Local stimulation (50 μA) was delivered at time 0 (arrow with dotted line). Twenty consecutive traces were superimposed. Spontaneous discharges were inhibited by the stimulation. A2, A3, Raster and PSTHs (100 trials; bin width, 1 ms) recorded from the same neuron to local stimulation of 30 μA (A2) and 50 μA (A3). Local stimulation was delivered at time 0 (arrows). The mean firing rate and statistical levels of p < 0.05 (one-tailed t test) are indicated in PSTHs by a black and white dashed line (mean), a black solid line (upper limit), and a white solid line (lower limit), respectively. B, Responses of another GPi neuron. Local stimulation (30 μA) was delivered at time 0 (arrow with dotted line). The neuron exhibited weak excitation (arrowhead) preceding the inhibition. C, Durations of inhibition of GPi neurons evoked by local single-pulse stimulation of 30 μA (n = 18) and 50 μA (n = 20) are plotted against the distances between the recording and stimulating electrodes. Liner regression lines for 30 and 50 μA stimulation were calculated.
